


Key takeaways:
-
Bitcoin ETFs recorded $240 million in inflows on Thursday, ending a six-day outflow streak.
-
Bitcoin’s failure to drop below the 50-day EMA suggests strong support in this area.
Bitcoin (BTC) exchange-traded funds (ETFs) ended a six-day outflow streak with inflows returning on Thursday, leading traders to believe that a recovery is imminent as long as the BTC price holds the 50-week EMA.
Spot Bitcoin ETFs post $240 million inflows
US-based spot Bitcoin ETFs ended a six-day streak of net outflows on Thursday, with $240 million in daily inflows.

The outflow streak started on Oct. 29 and extended through Wednesday, with the biggest outflows comprising $577.74 million on Tuesday.
Related: Crypto ETFs ‘punching above weight’ as almost half of ETF investors plan buys
The streak of outflows followed a Bitcoin market correction that saw BTC price plunge below $100,000 for the first time since June. On Tuesday, the BTC/USD pair reached a four-month low of $98,900. Since then, the price had recovered 3% on Friday.
The largest inflow was from BlackRock’s ETF, IBIT, at $112.4 million. Fidelity’s FBTC followed with $61.6 million, while ARK Invest’s ARKB added $60.4 million.
Bitwise’s BITB posted moderate inflows of $5.5 million and $2.48 million, while the rest of the ETFs saw no inflows or outflows.
Cumulative net inflows remain robust at $60.5 billion, and total net assets across all spot Bitcoin ETFs stand at $135.43 billion, accounting for 5.42% of Bitcoin’s total market capitalization.
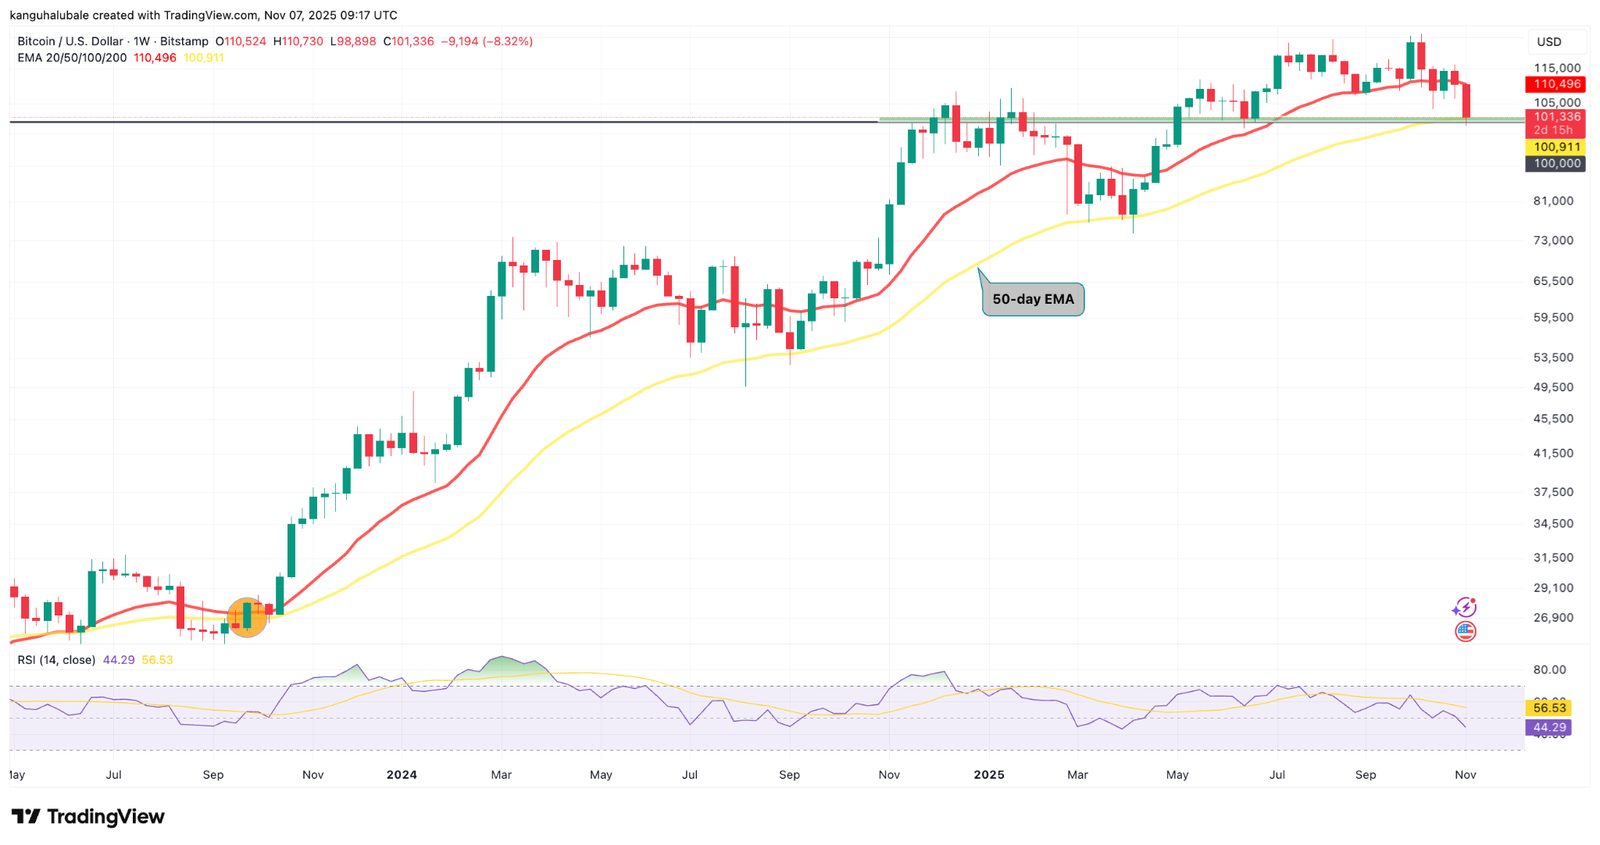
Bitcoin’s 50-day EMA is the “line in the sand”
After dropping to $98,000 on Tuesday, Bitcoin quickly reclaimed the $100,000 psychological level, which coincided with the 50-day exponential moving average (EMA). This suggested that bulls were aggressively defending this level.
Note that this trendline (yellow line in the chart below) has supported the price since September 2023, and losing it would be detrimental for the bulls.
Bitcoin is “sitting right at the 50-week SMA, the line in the sand,” said YouTuber Lark Davis in a Thursday post on X, adding
“If we close below the 50-week SMA, things could get complicated.”
“So far Bitcoin is still holding the 50-week EMA,” pseudonymous technical analyst Chad said, adding that it is important for the BTC/USD pair to close the week above this level.
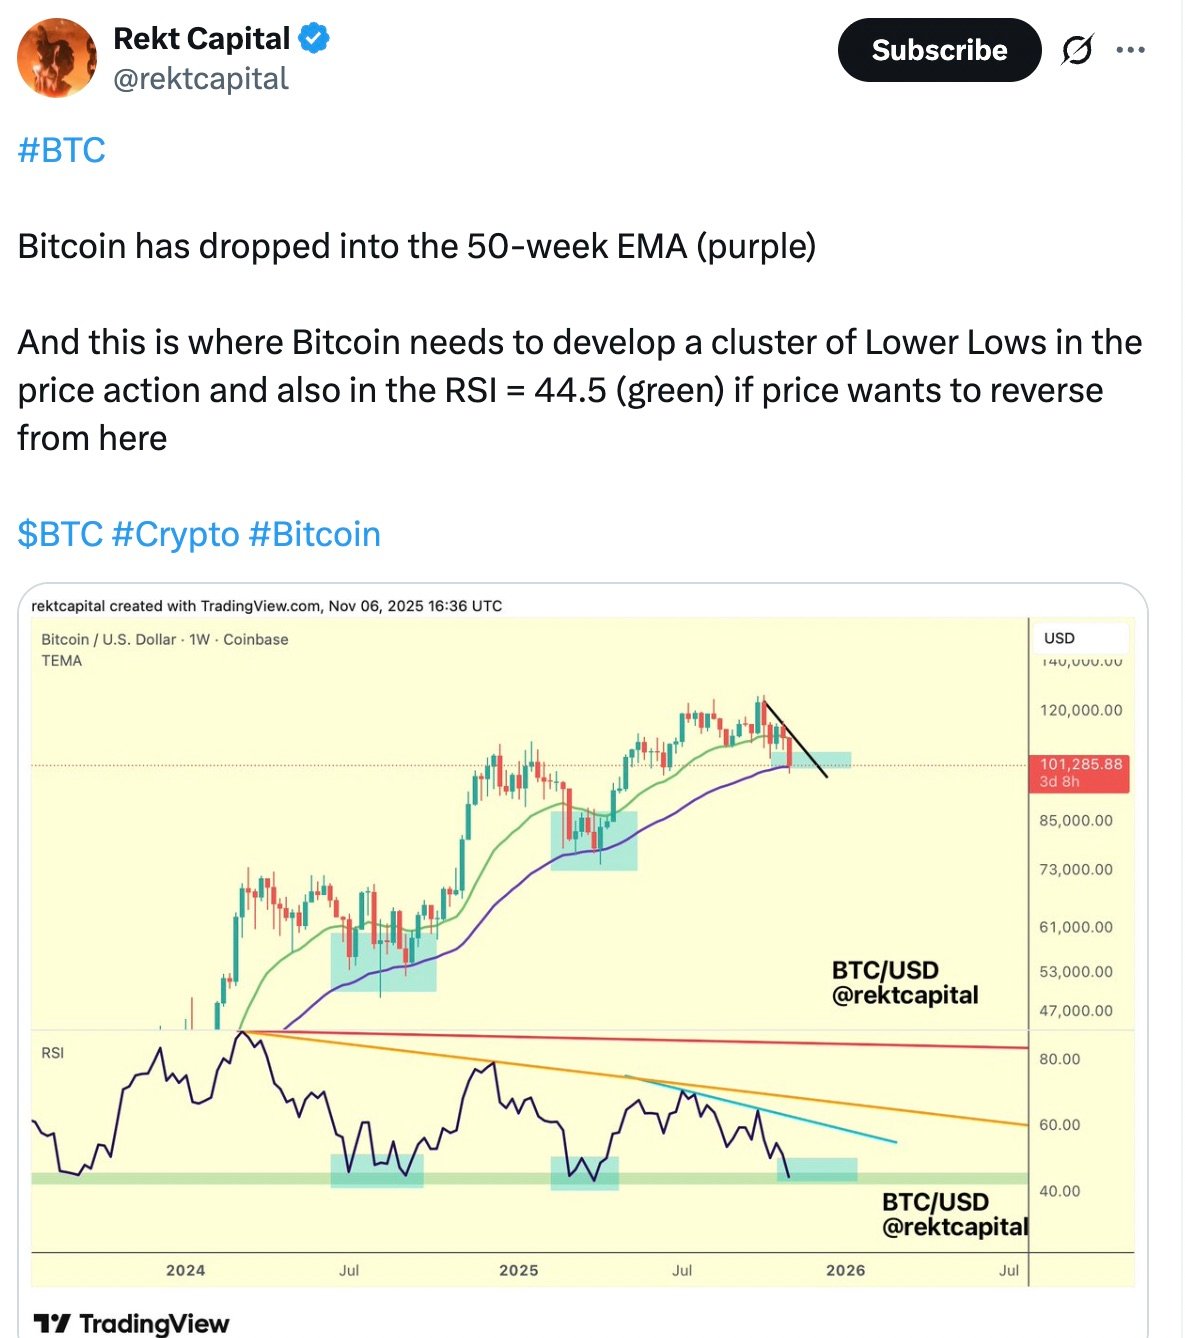
Fellow analyst Rekt Capital said that Bitcoin appears to be bottoming out around the 50-day EMA and must make a “cluster of lower lows” at this level to establish a bottom.
As Cointelegraph reported, the MVRV ratio suggested $98,000 may have indeed marked the local bottom for BTC, suggesting that the price can recover due to seller exhaustion.
This article does not contain investment advice or recommendations. Every investment and trading move involves risk, and readers should conduct their own research when making a decision.
