


The recent movement of the USD/JPY has been very choppy as it continues to trade within a four-month-plus “Ascending Wedge” range configuration since its 22 April 2025 low of 139.89.
The initial 0.8% intraday rally of the US dollar against the Japanese yen at the start of this week’s Asia session on Monday, 8 September 2025, to hit an intraday high of 148,58 has evaporated as the USD/JPY is now trading almost unchanged week-to-date as of Thursday, 11 September, at 147.40.
Market participants have largely looked beyond the political uncertainty stemming from Prime Minister Ishiba’s resignation, shifting their focus to factors that could shape the Bank of Japan’s ongoing monetary policy normalization path.


Let’s examine these fundamental factors.
Japan’s PPI is still evolving in an upward trend, a leading indicator of core-core CPI
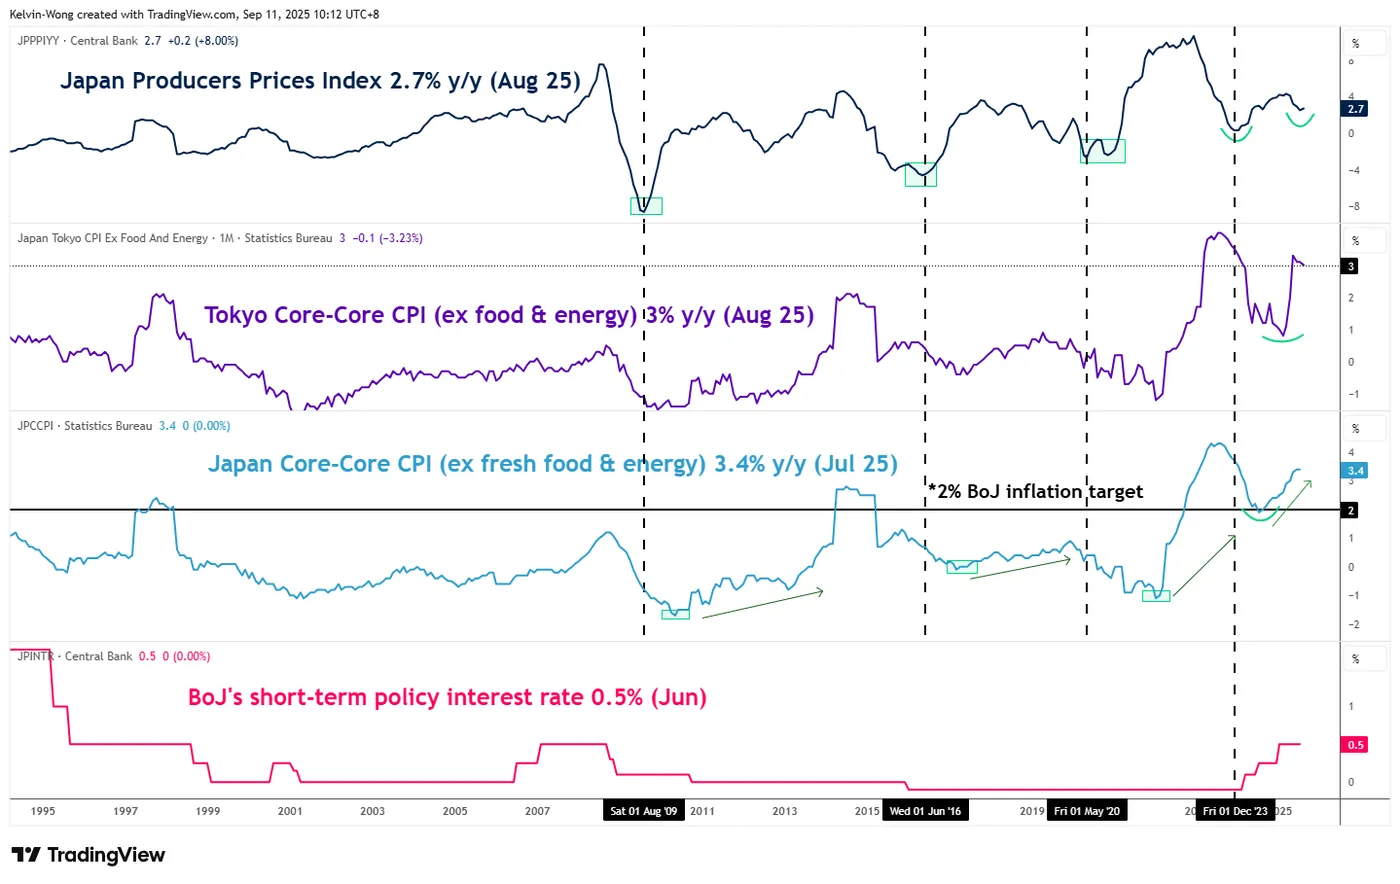
Fig. 1: Japan PPI & core-core CPI as of Aug 2025 (Source: TradingView)
One of the key economic indicators that the BoJ monitors to formulate its monetary policy decision is Japan’s nationwide core-core CPI inflation trend (excluding fresh and energy).
Interestingly, the trend of Japan’s producers’ price index (PPI), a gauge that measures companies’ input costs, has a lead time ahead of the core-core CPI.
Based on past data, Japan’s PPI bottomed out and reversed upwards ahead of Japan’s core-core CPI inflation in August 2009, June 2016, May 2020, and most recently December 2023.
The latest print of Japan’s PPI has started to firm up after a slowdown in growth of 4.3% y/y in March 2025. The PPI rose 2.7% y/y in August 2025, accelerating from 2.5% y/y in the previous month of July (see Fig. 1).
Hence, a continuation of an upward growth trend in Japan’s PPI is likely to have a trickle-down effect on the core CPI inflation trend to allow it to trend higher above the BoJ’s long-term inflation target of 2%, in support of a continuation of the BoJ’s gradual interest rate hikes in place since March 2024.
Overall, a supporting fundamental element that can assert upside pressure on the Japanese yen.
Narrowing of the longer-term yield spread between US Treasury bonds and JGBs
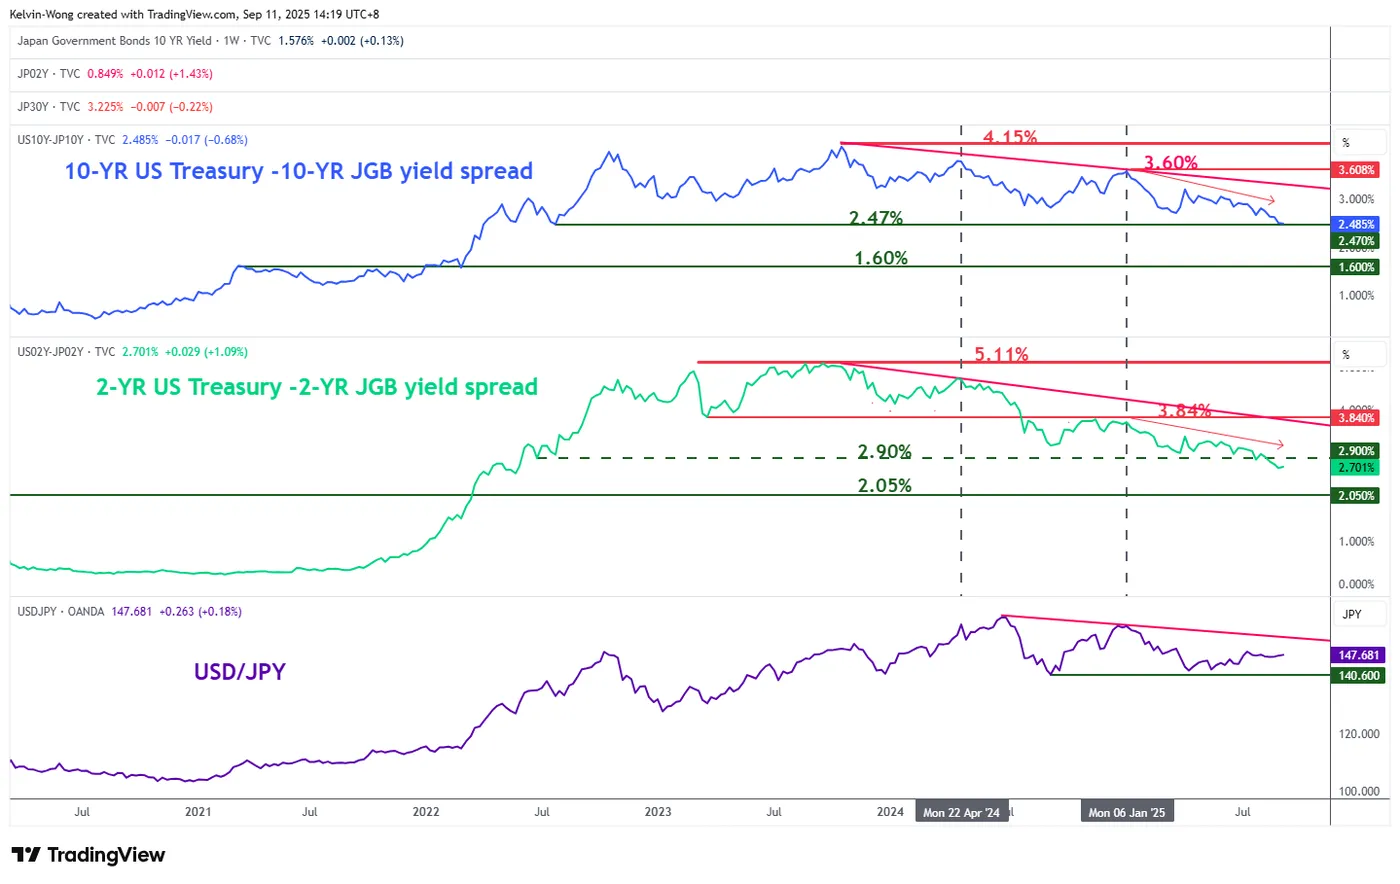
Fig. 2: 10-year and 2-year yield spreads of US Treasuries and JGBs as of 11 Sep 2025 (Source: TradingView)
The 10-year sovereign bond yield of a country often serves as a key gauge of its long-term inflation outlook and economic growth prospects.
A relative comparison of these expectations between two countries can be captured through the 10-year yield spread of their sovereign bonds.
For instance, the yield spread between the 10-year US Treasury and the Japanese Government Bond (JGB) has been narrowing since October 2025, falling from 4.15% to the current level of 2.48%, just above a critical support at 2.47% (see Fig. 2).
This narrowing suggests that US Treasuries have become relatively less attractive versus JGBs, reducing the yield premium in favour of the dollar. As a result, this dynamic may exert downside pressure on USD/JPY.
Let’s now examine the USD/JPY from a technical analysis perspective to determine its short-term (1 to 3 days) trend bias and key levels to watch.
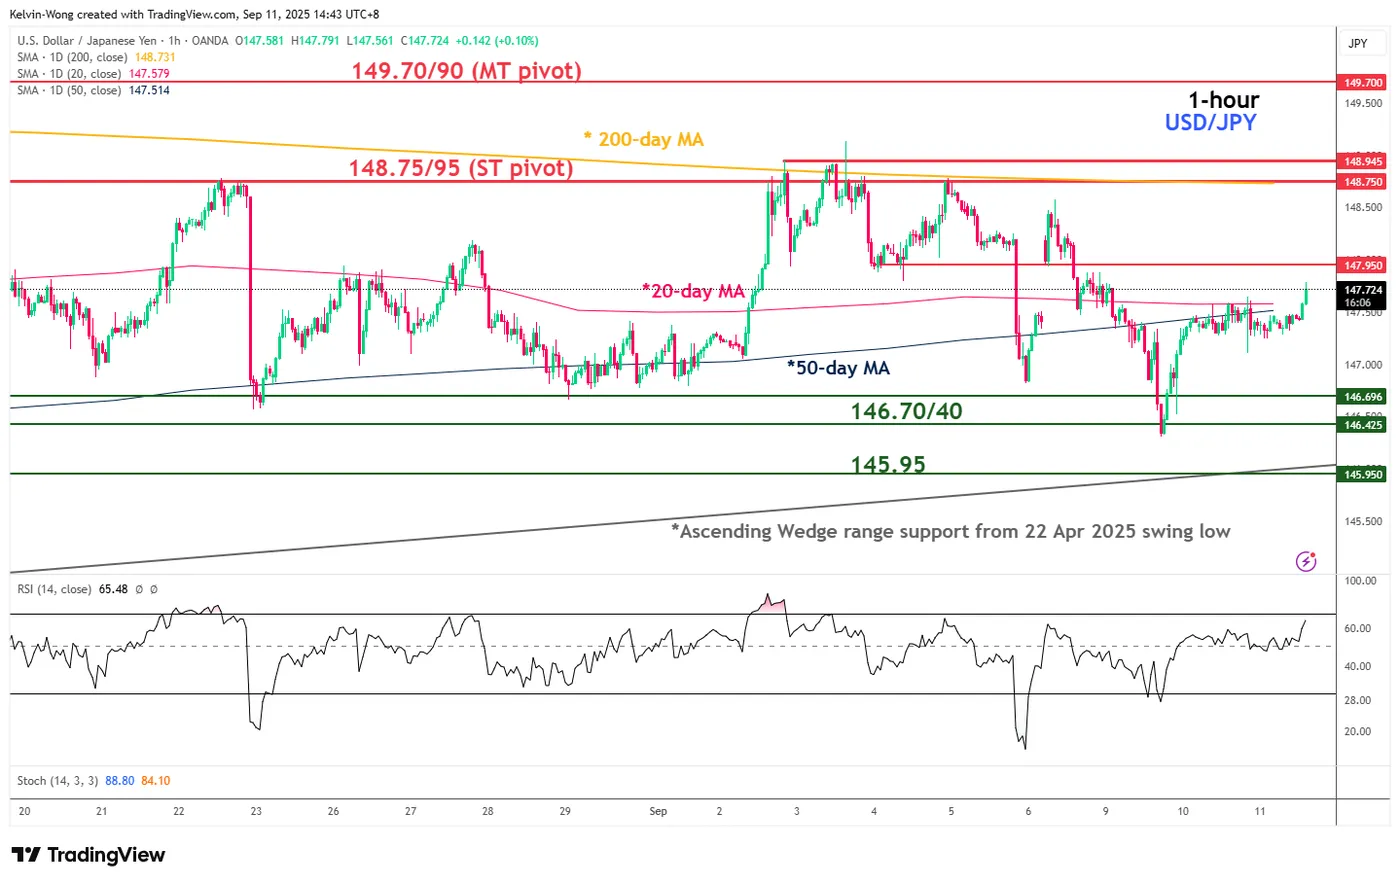
Fig. 3: USD/JPY minor trend as of 11 Sep 2025 (Source: TradingView)
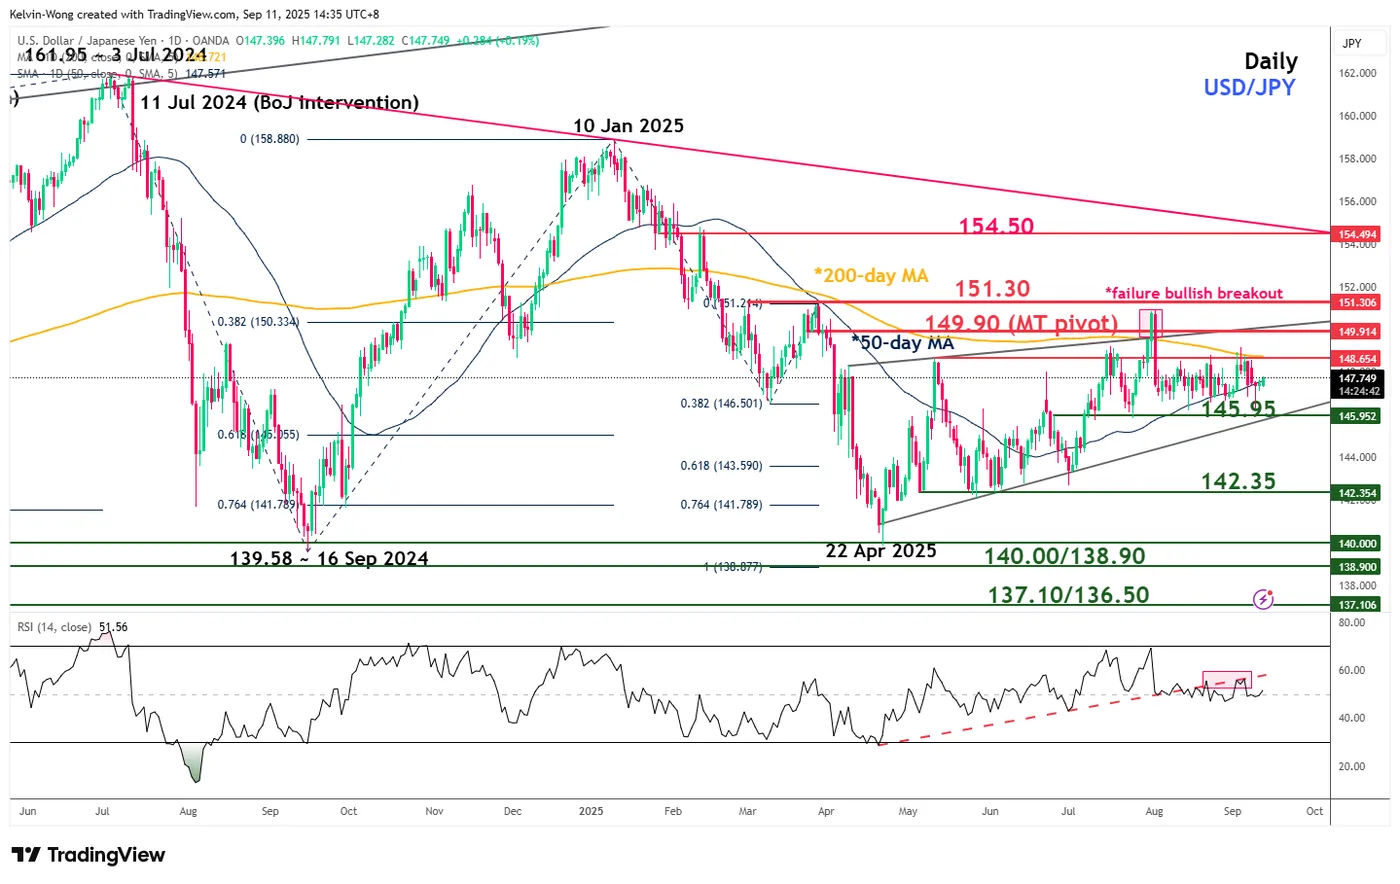
Fig. 4: USD/JPY medium-term trend as of 11 Sep 2025 (Source: TradingView)
Preferred trend bias (1-3 days)
Potential push down towards minor range support of 146.70/146.40 in place since 5 August 2025, with key short-term pivotal resistance at 148.75/148.95 (see Fig. 3).
A break below 146.40 may trigger a further drop to test the medium-term “Ascending Wedge” range support of 145.95.
Key elements
- The USD/JPY is stuck inside a medium-term “Ascending Wedge” range configuration in place since the 22 April 2025 low. The upper boundary/resistance of the range stands at 149.90, and the lower boundary/support of the range rests at 145.95 (see Fig. 4).
- The hourly RSI momentum has ticked up higher to 66, which is coming close to its overbought region (above 70), which suggests a potential imminent mean reversion downside movement for the USD/JPY within its range configuration.
- The USD/JPY is still trading below its key 200-day moving average, which is acting as a resistance at 148.75.
Alternative trend bias (1 to 3 days)
A clearance above 148.95 invalidates the bearish scenario for the USD/JPY and sees a squeeze up towards the key medium-term resistance of 149.70/149.90 (the upper boundary of the “Ascending Wedge”).
