


Among the underlying components of the Russell 3000 index, we saw noteworthy options trading volume today in Alcoa Corporation (Symbol: AA), where a total of 32,862 contracts have traded so far, representing approximately 3.3 million underlying shares. That amounts to about 45.3% of AA’s average daily trading volume over the past month of 7.3 million shares. Particularly high volume was seen for the $50 strike call option expiring June 18, 2026, with 5,247 contracts trading so far today, representing approximately 524,700 underlying shares of AA. Below is a chart showing AA’s trailing twelve month trading history, with the $50 strike highlighted in orange:
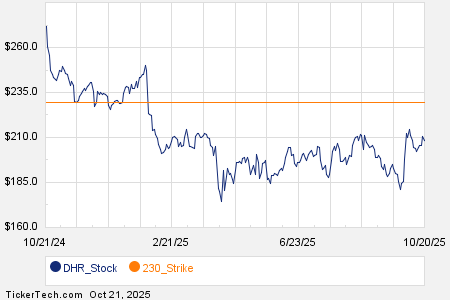
Danaher Corp (Symbol: DHR) options are showing a volume of 21,833 contracts thus far today. That number of contracts represents approximately 2.2 million underlying shares, working out to a sizeable 44.4% of DHR’s average daily trading volume over the past month, of 4.9 million shares.
Particularly high volume was seen for the $230 strike call option expiring January 16, 2026, with 2,161 contracts trading so far today, representing approximately 216,100 underlying shares of DHR. Below is a chart showing DHR’s trailing twelve month trading history, with the $230 strike highlighted in orange:
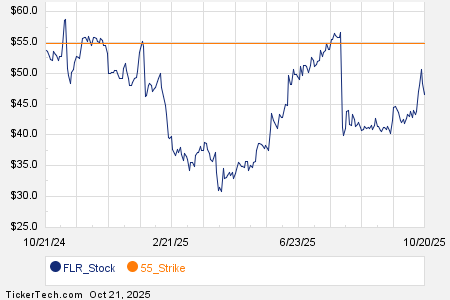
And Fluor Corp. (Symbol: FLR) options are showing a volume of 15,939 contracts thus far today. That number of contracts represents approximately 1.6 million underlying shares, working out to a sizeable 43.8% of FLR’s average daily trading volume over the past month, of 3.6 million shares.
Especially high volume was seen for the $55 strike call option expiring November 21, 2025, with 2,226 contracts trading so far today, representing approximately 222,600 underlying shares of FLR. Below is a chart showing FLR’s trailing twelve month trading history, with the $55 strike highlighted in orange:

For the various different available expirations for AA options, DHR options, or FLR options, visit StockOptionsChannel.com.
![]() Today’s Most Active Call & Put Options of the S&P 500 »
Today’s Most Active Call & Put Options of the S&P 500 »
Also see:
TKF Historical Stock Prices
CGA Options Chain
FFIC Price Target
The views and opinions expressed herein are the views and opinions of the author and do not necessarily reflect those of Nasdaq, Inc.
