


Key points:
-
Bitcoin is approaching the start of its bear market if four-year cycle theory is still valid.
-
BTC price targets include $50,000 for October 2026.
-
Bitcoin is currently battling a resistance trend line that could spark a $100,000 support retest.
Bitcoin (BTC) could have just one month before the end of a four-year cycle, triggering a $50,000 collapse.

New comments from Joao Wedson, founder and CEO of crypto analytics platform Alphractal, also include a $140,000 BTC price target.
Can Bitcoin escape its scheduled bear market?
Bitcoin faces a new reckoning as the bull market endures its latest 15% correction from all-time highs.
Amid misgivings over the future, Wedson sees the possibility of a new bear market starting as soon as October.
Uploading charts of its so-called “Repetition Fractal Cycle” to X, he showed that BTC/USD is approaching the time when bear markets historically take over.
“Of course, it would be reckless to assume that Bitcoin has only a little over one month left in this cycle based solely on this chart,” he acknowledged.
“Still, I can’t help but think — this could be just enough time for BTC to dip toward the $100K range before rocketing past $140K within the same period. Who would dare to doubt that scenario?”
Wedson notes that this cycle is markedly unlike others before it, thanks to the presence of major institutional investors and Bitcoin’s ascent to major asset status.
“The real question is whether this fractal will remain reliable in the face of heavy speculation around ETFs and growing institutional demand,” he said.
A US macroasset bear market could well form the nail in the coffin for Bitcoin bulls if it coincides with the fractal’s bear-market schedule.
The question boils down to the status of the four-year price cycle amid increasing debate over its relevance in 2025.
Once October hits and if bears gain strength, BTC price bottom targets, already bold, now include one more level on the radar for October 2026. Wedson said:
“Personally, I’m eager to see whether the new wave of crypto enthusiasts are right in claiming the 4-year cycle is over and Bitcoin will now rise endlessly — or if 2025 marks the final breath before a sharp correction, with prices possibly sinking below $50K in the 2026 bear market.”
All eyes on the $100,000 BTC price battle
As Cointelegraph continues to report, market participants favor a $100,000 support retest as part of the current correction.
Related: Bitcoin short-term holders spark rare BTC price bottom signal at $107K
One trader even sees that event coming this week. He said the bull market will be over if the bulls fail to hold the $100,000 mark.
BTC/USD is attempting to break through a downward-sloping trend line, which has formed the ceiling for price throughout the correction that began in mid-August.
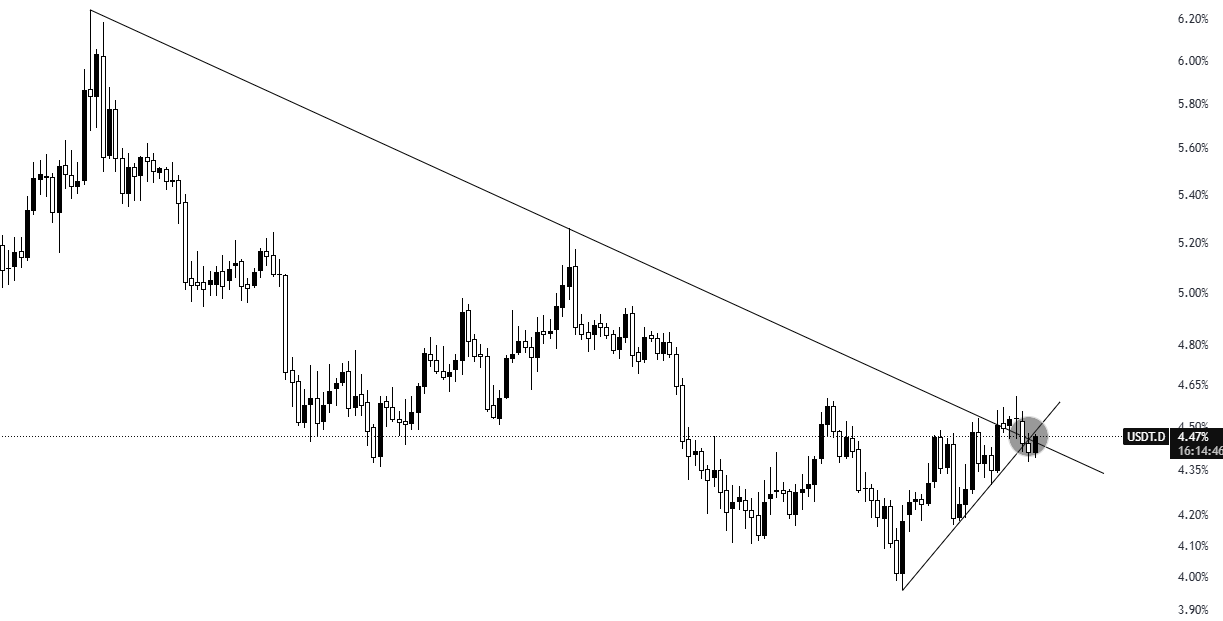
However, another chart provides another angle: Tether’s market share. USDT.D, or its market dominance, is testing a downward-sloping trendline. Over the past year, BTC price and USDT.D have been going in opposite directions.
“This 1 chart decides if $BTC breaks below $100K or breaks to new ATH,” trader Killa told X followers Thursday.
This article does not contain investment advice or recommendations. Every investment and trading move involves risk, and readers should conduct their own research when making a decision.
