


Key takeaways:
-
Bitcoin risks a correction toward $96,500–$100,000 if the $110,000 support fails.
-
Onchain and technical patterns suggest a healthy mid-cycle reset, not a full trend reversal.
Bitcoin’s (BTC) rebound after a major weekend plunge showed signs of fading on Tuesday.
The top crypto dipped 4.65% to around $110,000, mirroring a global equity slump after China imposed restrictions on five US firms linked to South Korea’s largest shipbuilder, warning of further retaliation.

Bitcoin’s $110,000 level has repeatedly flipped between resistance and support in 2025. Earlier rejections triggered 19–30% declines, while post-July rebounds from this zone fueled 12–15% rallies.
Let’s examine how low BTC could go if the $110,000 support fails.
Bitcoin’s broadening wedge hints at $100,000
Multiple analyses suggest that the odds of the BTC price declining toward $100,000 increase if the $110,000 support level fails to hold.
That includes a “giant bullish channel” highlighted by chartist BitBull, which showed BTC price fluctuating inside a broadening wedge.
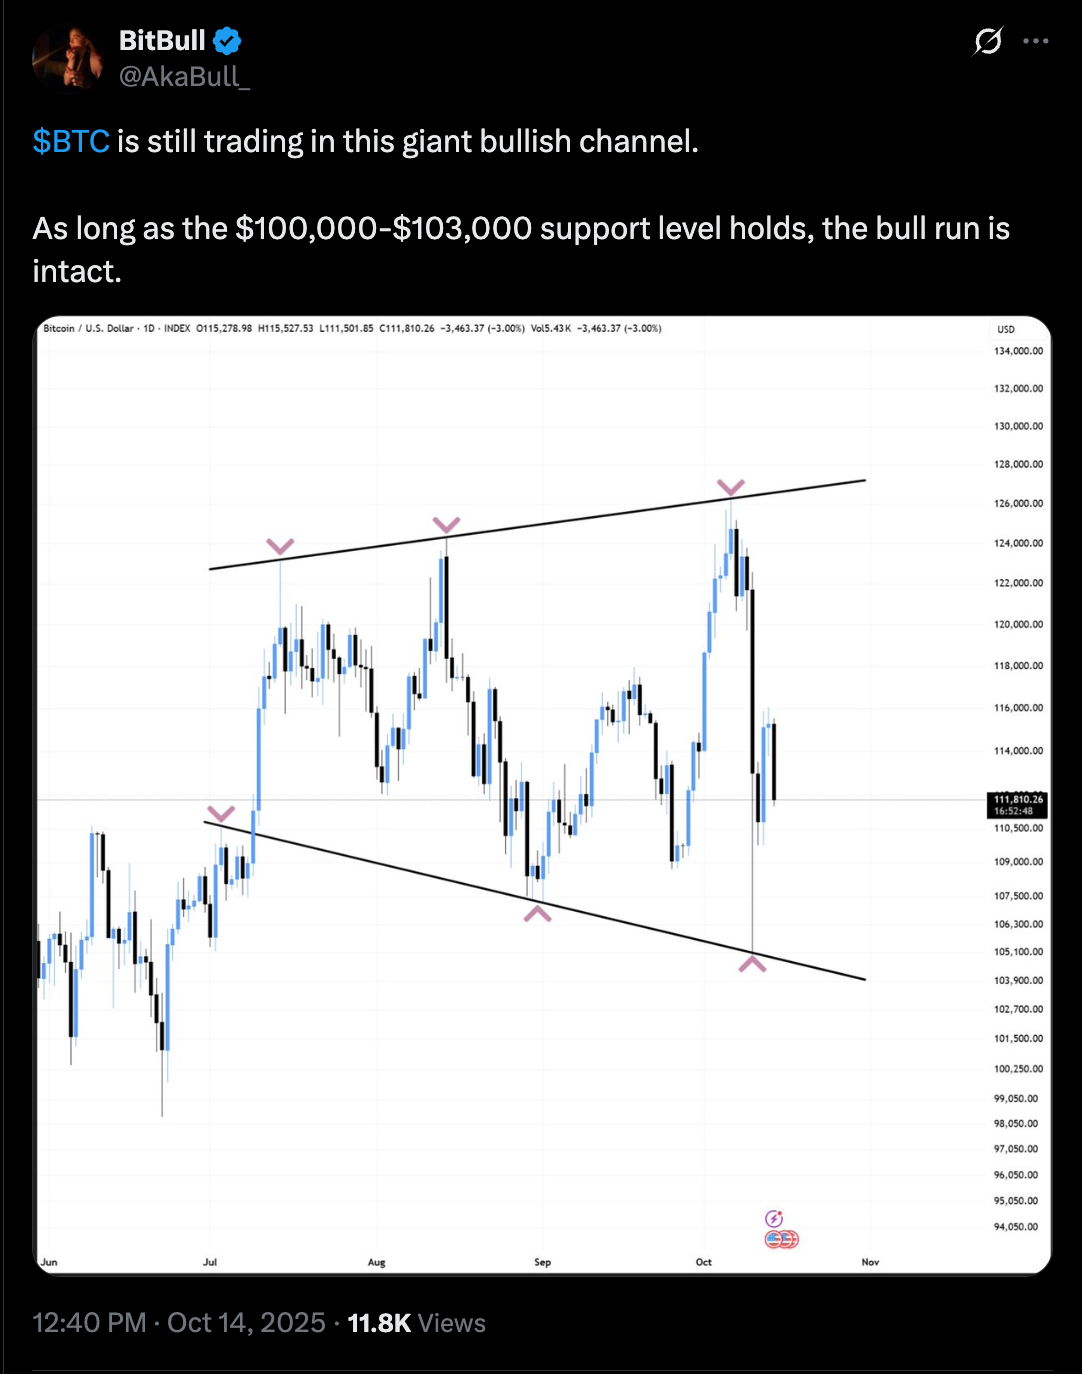
As of Tuesday, Bitcoin was in the middle of a correction stage after testing the wedge’s upper trendline as resistance. Historically, such corrections exhausted near the channel’s lower trendline, which coincides with the $100,000-$103,000 area.
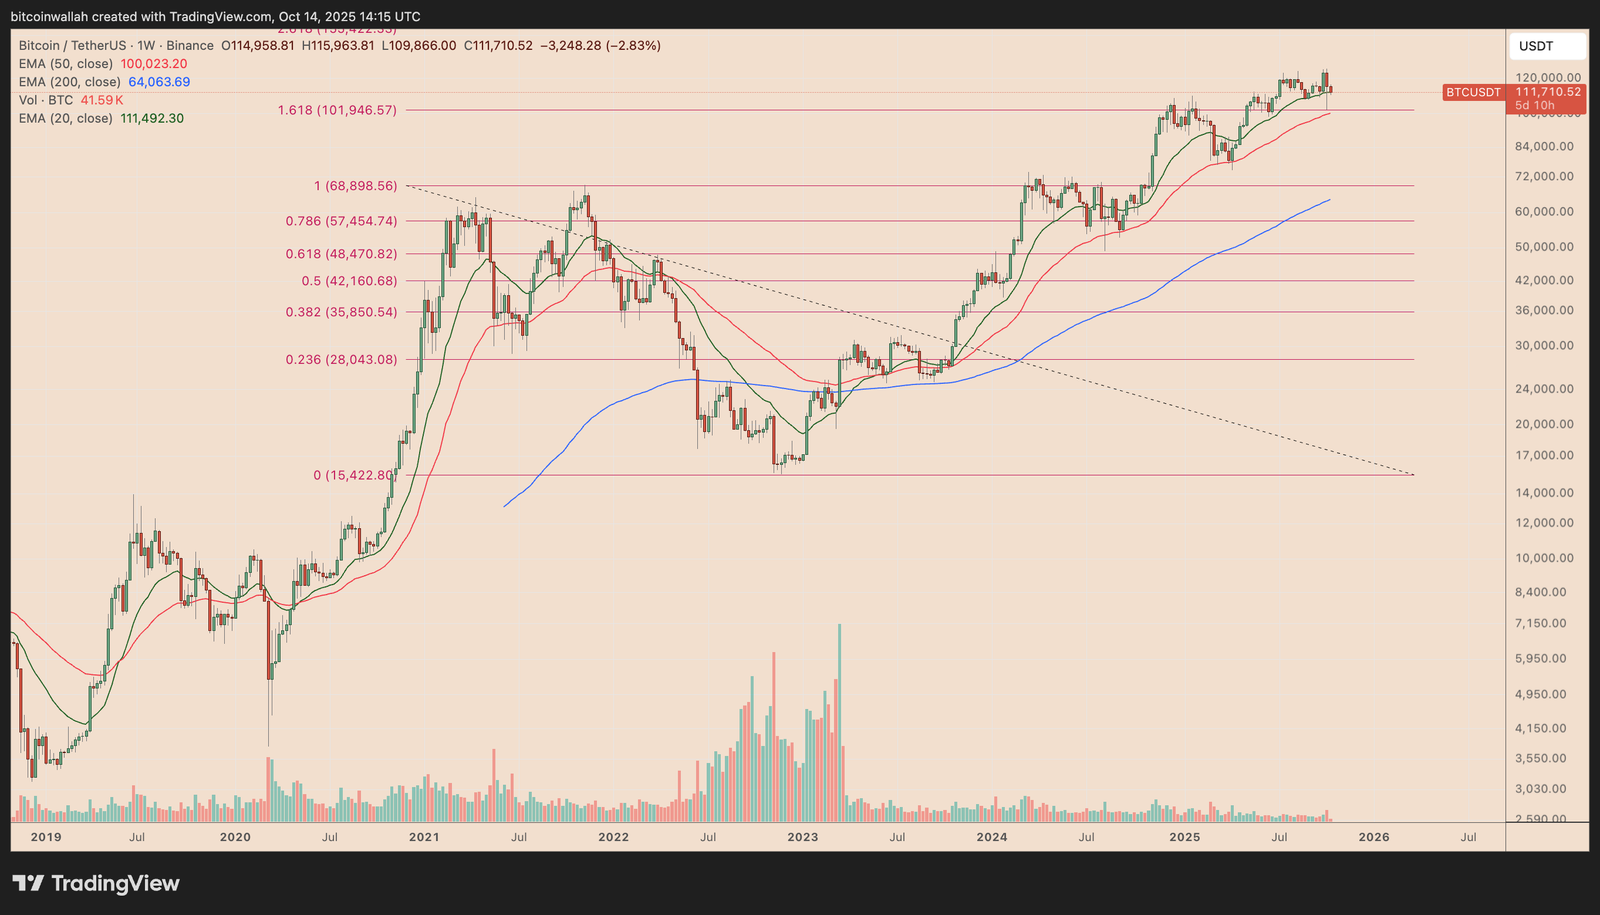
This region also aligns with Bitcoin’s 50-week exponential moving average (50-week EMA, represented by the red wave) and the 1.618 Fibonacci retracement line, lending technical weight to it as a potential target zone.
BTC metric suggests $96,500 target (or worse)
Bitcoin is now trading below its +0.5 standard deviation band (+0.5σ band; orange) near $119,000, according to Glassnode’s MVRV Extreme Deviation Pricing Bands.
The MVRV Extreme Deviation Pricing Bands is an onchain model that tracks how far the current market price deviates from Bitcoin’s “fair value,” based on what most holders paid for their coins (the realized price).
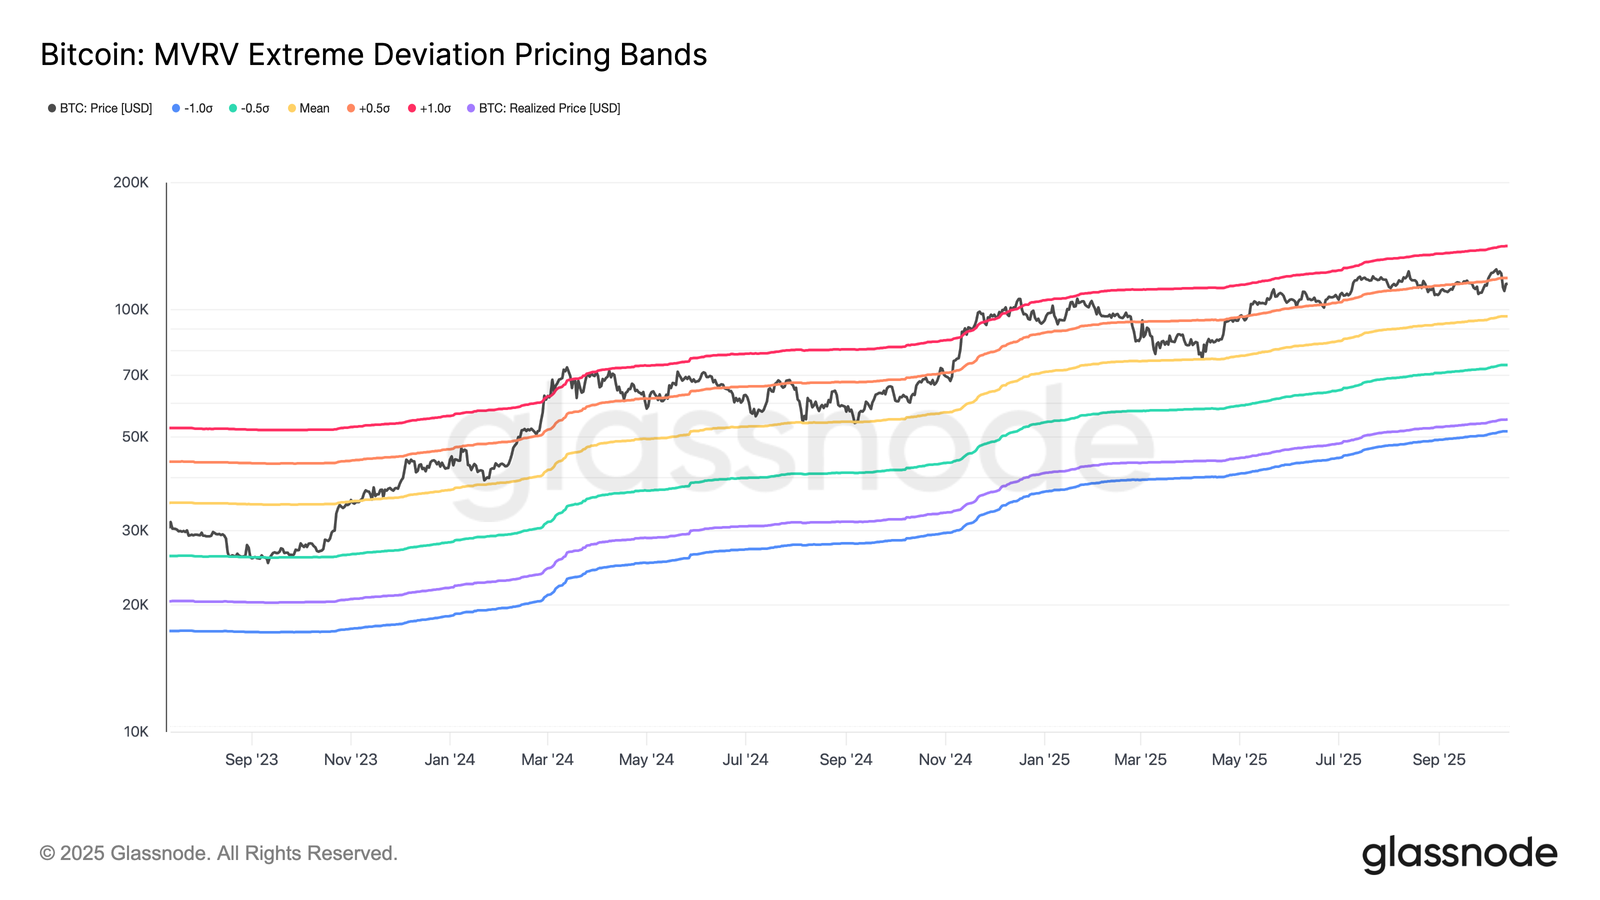
Historically, when BTC loses this +0.5σ band as support, it tends to revert toward the mean band (yellow), which currently sits around $96,500.
A similar “mean reversion” phase occurred during the December 2024–April 2025 correction, when Bitcoin dropped from the +0.5σ level (~66,980) to the mean band (~$53,900) before rebounding sharply.
Related: 3 reasons why a Bitcoin rally to $125K could be delayed
This fractal suggests the current setup may simply be another cooling-off phase within a broader bull market, a reset to shake out excess leverage and overheated valuations before the next leg higher.
A drop below the mean reversion target, however, could risk triggering a bear market, with the next downside target at around $74,000.
This article does not contain investment advice or recommendations. Every investment and trading move involves risk, and readers should conduct their own research when making a decision.
