


Key takeaways:
-
BTC has rallied between 145% and 304% within a year of past gold peaks.
-
The top crypto can rally to as high as $400,000 if the gold fractal repeats.
Gold price (XAU) just printed a fresh record above $3,500 (per ounce), driven by bets on upcoming Fed rate cuts.
Its “safe-haven” rival, Bitcoin (BTC), may follow with a stronger, higher-beta move within a year if history is a guide.

BTC price rallies a minimum 145% after gold peaks
Previous gold all-time highs show BTC usually lags at first, then outperforms on a six-12 month horizon.
In August 2011, when gold hit $1,921, Bitcoin rose by 145% a year later. After the precious metal’s August 2020 peak of around $2,070, BTC gained 68% in three months, 286% in six and 315% in 12.
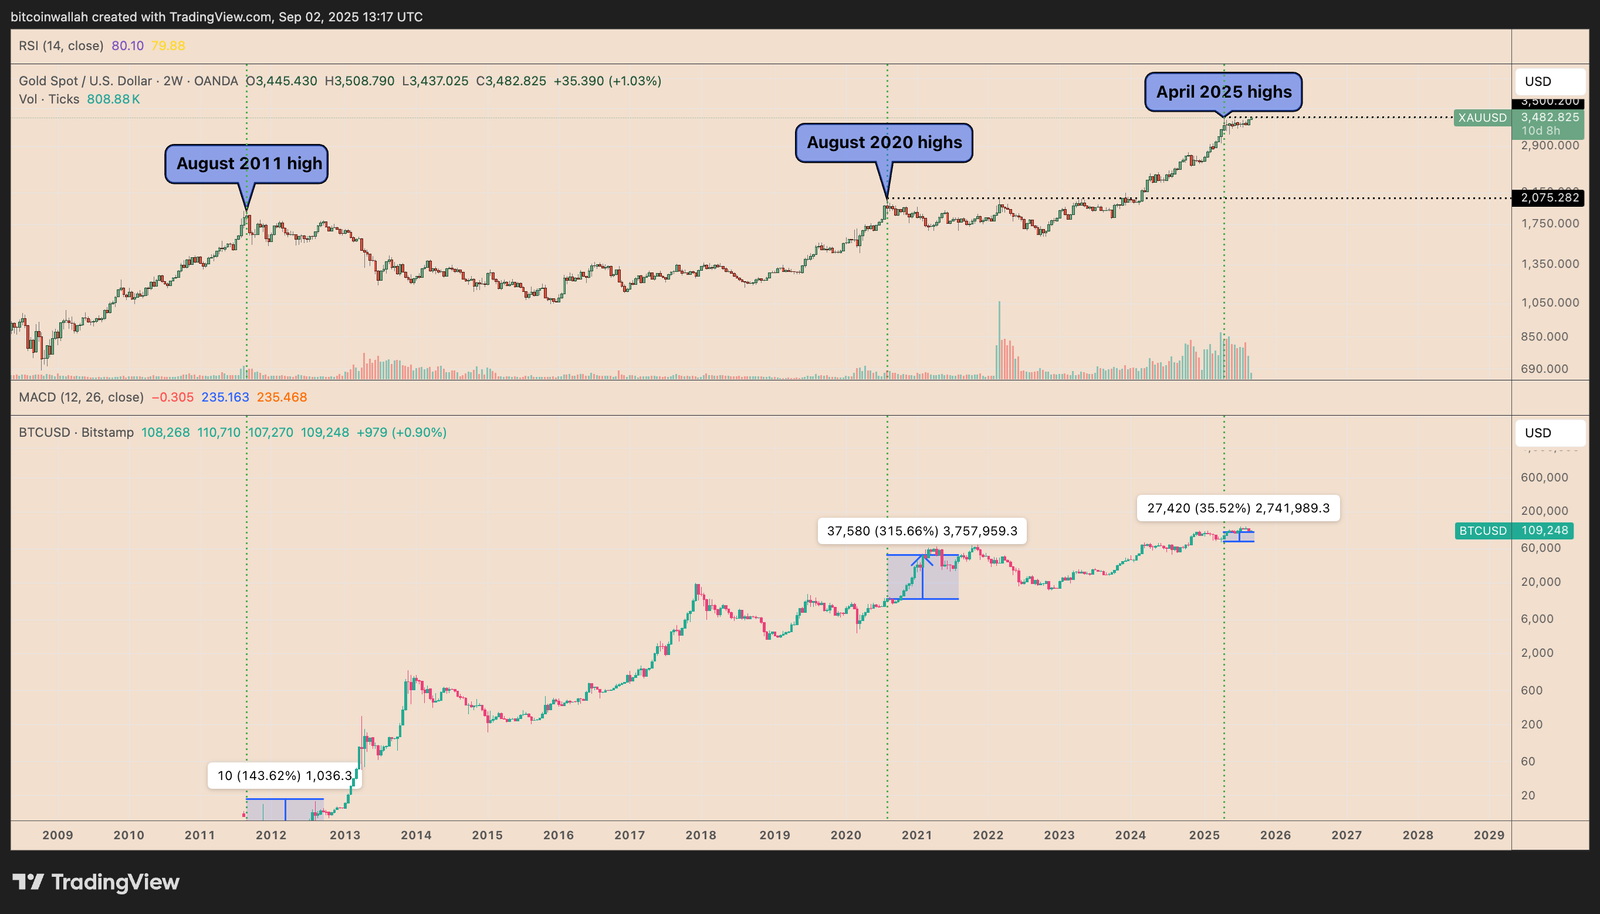
More recently, when gold hit a record high of $3,500 in April, BTC rose by around 35% over the next three months.
Across the two completed cycles (2011 and 2020), BTC’s median post-gold-ATH return is about 30% at three months and 225% at 12 months, showing that gold sets the tone, but Bitcoin usually takes the lead.
This happens because gold is the traditional first choice when investors get nervous. However, once gold is up and people start looking for bigger gains, money often moves into Bitcoin, which many traders consider a higher-risk, higher-reward “digital gold.”
How high can Bitcoin price go next?
A repeat of the historical 30% median gain over three months after gold’s record highs would put Bitcoin in the $135,000–$145,000 range by early December, when measured from its current level near $110,000.
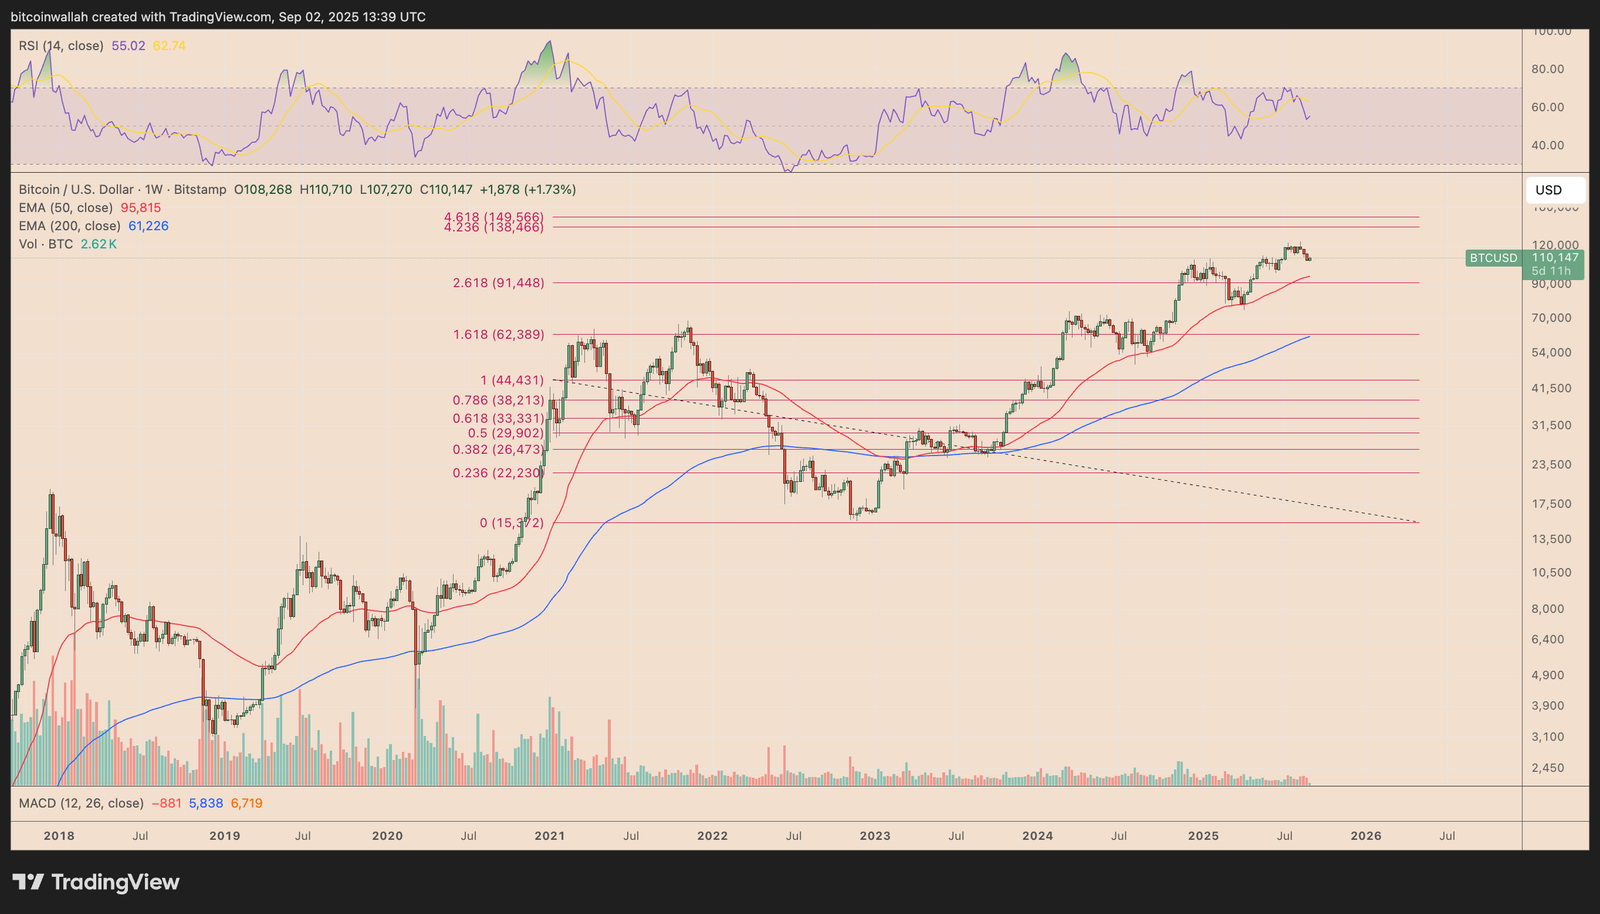
But BTC’s price could go as high as the $200,000–$400,000 range over the next year if it repeats its historical 145–304% gains seen after past gold records. That aligns with upside targets shared by multiple analysts, including Standard Chartered.
These price predictions hinge on how macro conditions unfold, particularly Fed policy, inflation trends, and US jobs data.
Related: Spot BTC, ETH ETFs see outflows as inflation ticks up under Trump tariffs
As of Tuesday, futures markets priced a 90% chance of a Fed rate cut in September, compared with roughly 80% a month earlier, according to CME.
A key risk is the bearish divergence on Bitcoin’s weekly chart: Price is making higher highs while RSI trends lower.
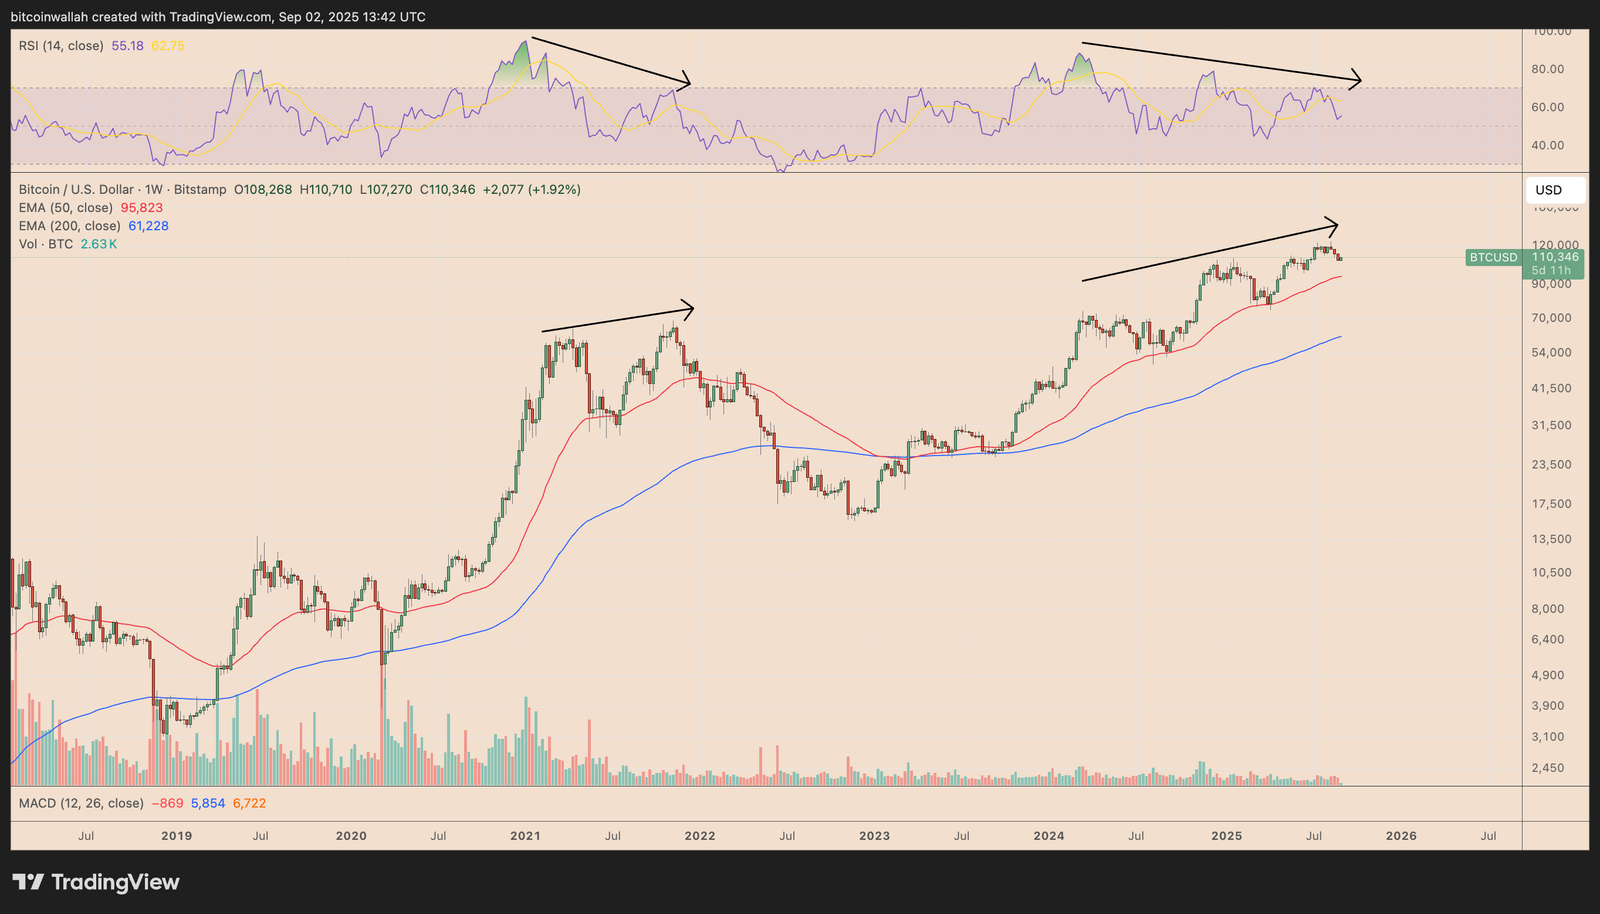
The same setup preceded the November 2021 peak, leading to a 70% decline, raising caution among traders for now.
This article does not contain investment advice or recommendations. Every investment and trading move involves risk, and readers should conduct their own research when making a decision.
