


The Hong Kong 33 CFD Index (a proxy for Hang Seng Index futures) delivered the anticipated bullish run between 13 and 25 August, reaching the short-term resistance level of 25,750 and posting an intraday high of 25,946 on 25 August.
Thereafter, its price actions have evolved into a choppy minor corrective decline sequence of -4.3% (high to low) within a medium-term uptrend phase from 25 August to 28 August, as short-term traders took profit due to fears of an overheated bull-run seen in the China “A” shares market towards the end of August
Margin financing in the Shanghai stocks rose to record highs in line with the Shanghai Stock Exchange Composite Index hitting a 10-year high, bringing the memories of the bursting of the 2015 stock market bubble in China that saw a massive decline of close to -50% in their respective benchmark stock indices.


Fundamentals continued to improve in the Chinese stock markets
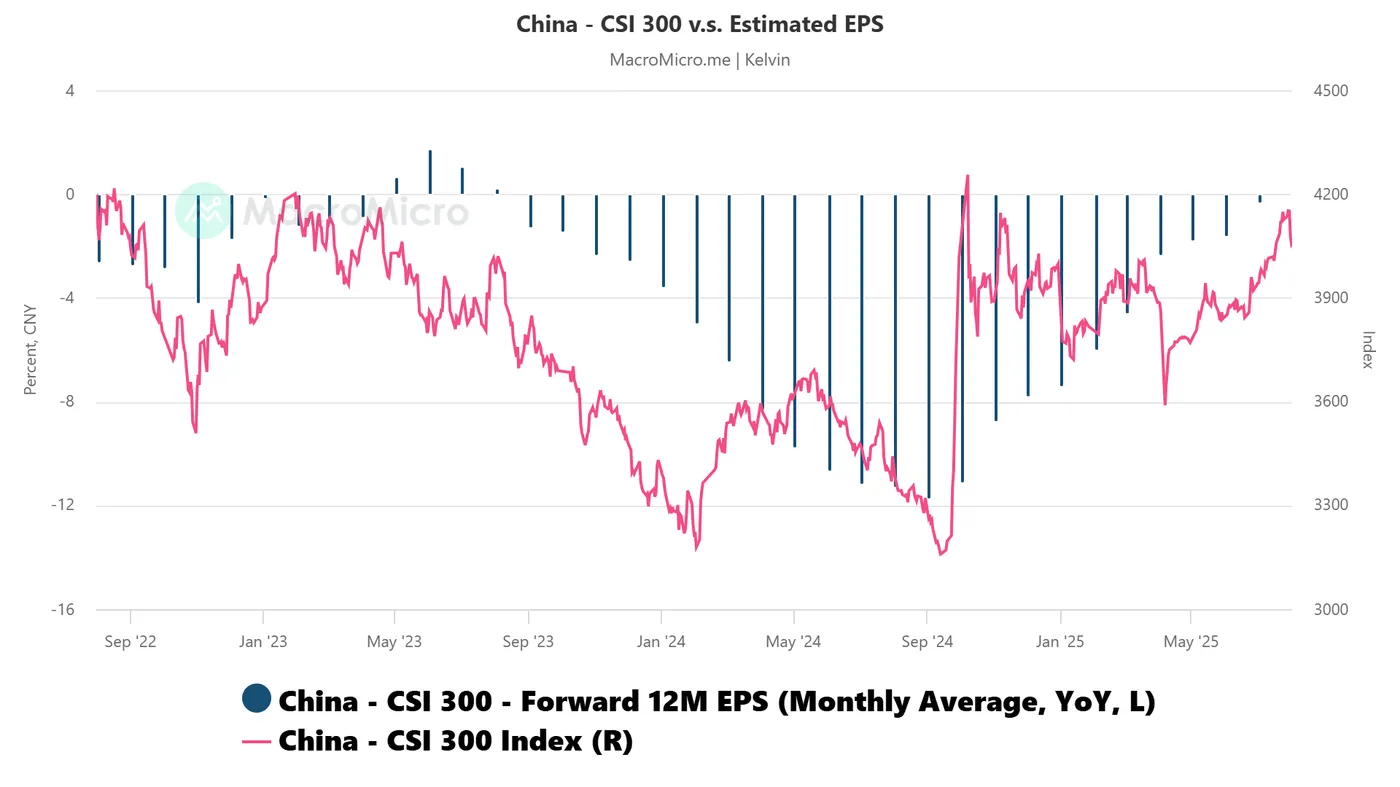
Fig. 1: China CSI 300 1-month forward EPS growth y/y as of Aug 2025 (Source: MacroMicro)
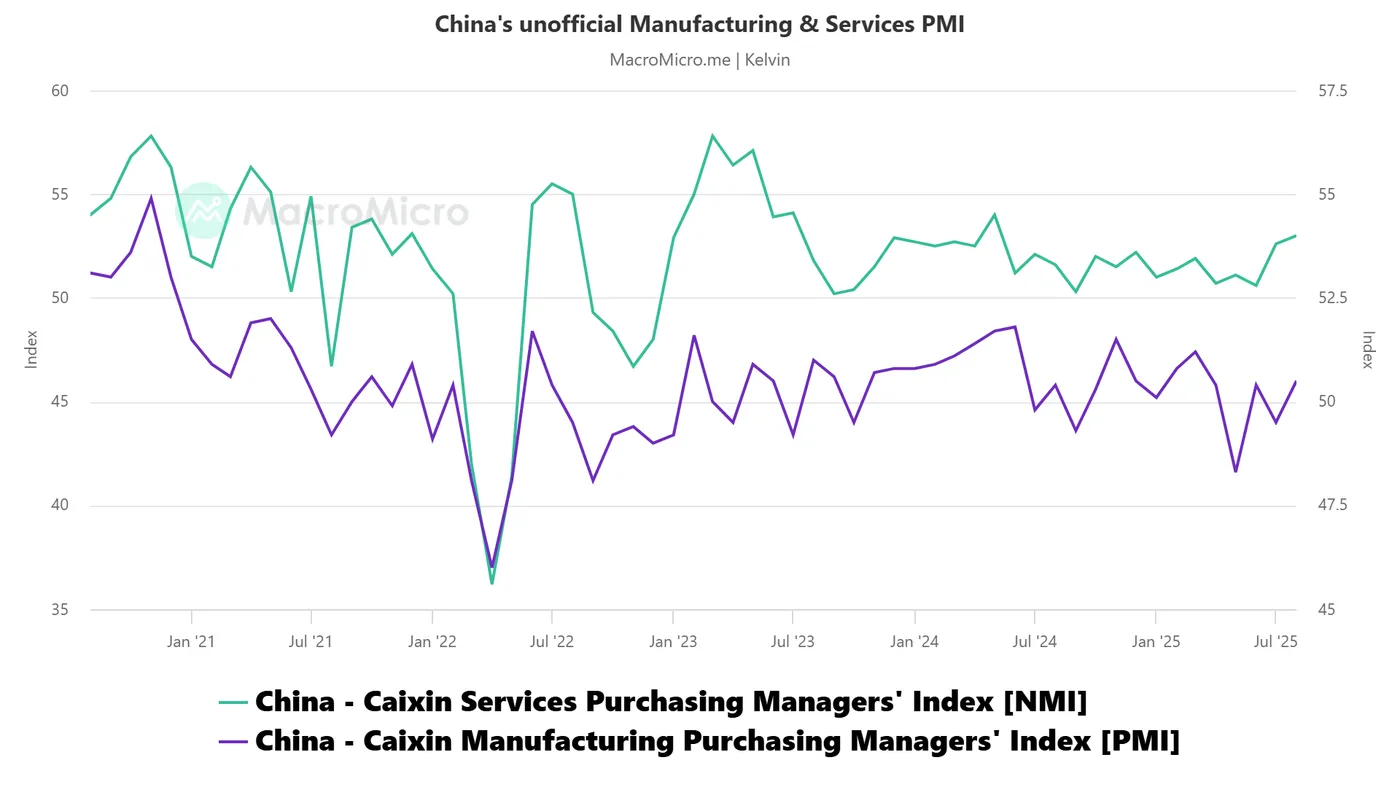
Fig. 2: China non-official Manufacturing & Services PMI as of Aug 2025 (Source: MacroMicro)
The monthly average of the 12-month forward earnings per share (EPS) growth for China’s CSI 300 (comprising component stocks from Shanghai and Shenzhen stock exchanges) has improved significantly in the past eight months; it rose from -7.4% y/y in January 2025 to -1.8% y/y in August 2025 (see Fig. 1).
The privately compiled (non-official) Manufacturing and Services PMIs, which track small and medium-sized enterprises in China, have returned to expansionary territory. The Manufacturing PMI rose to 50.5 in August 2025, recovering from a near three-year low of 48.3 in May. Similarly, the Services PMI strengthened to 53 in August, up from 50.6 in June (see Fig. 2).
These improvements in leading Chinese economic indicators suggest that deflation risks have eased, creating the potential for a positive feedback loop that could further support the Chinese stock market and, by extension, benefit Hong Kong equities.
Right now, let’s take a deep dive into the short-term (1 to 3 days) directional bias and key levels to watch on the Hong Kong 33 CFD Index.
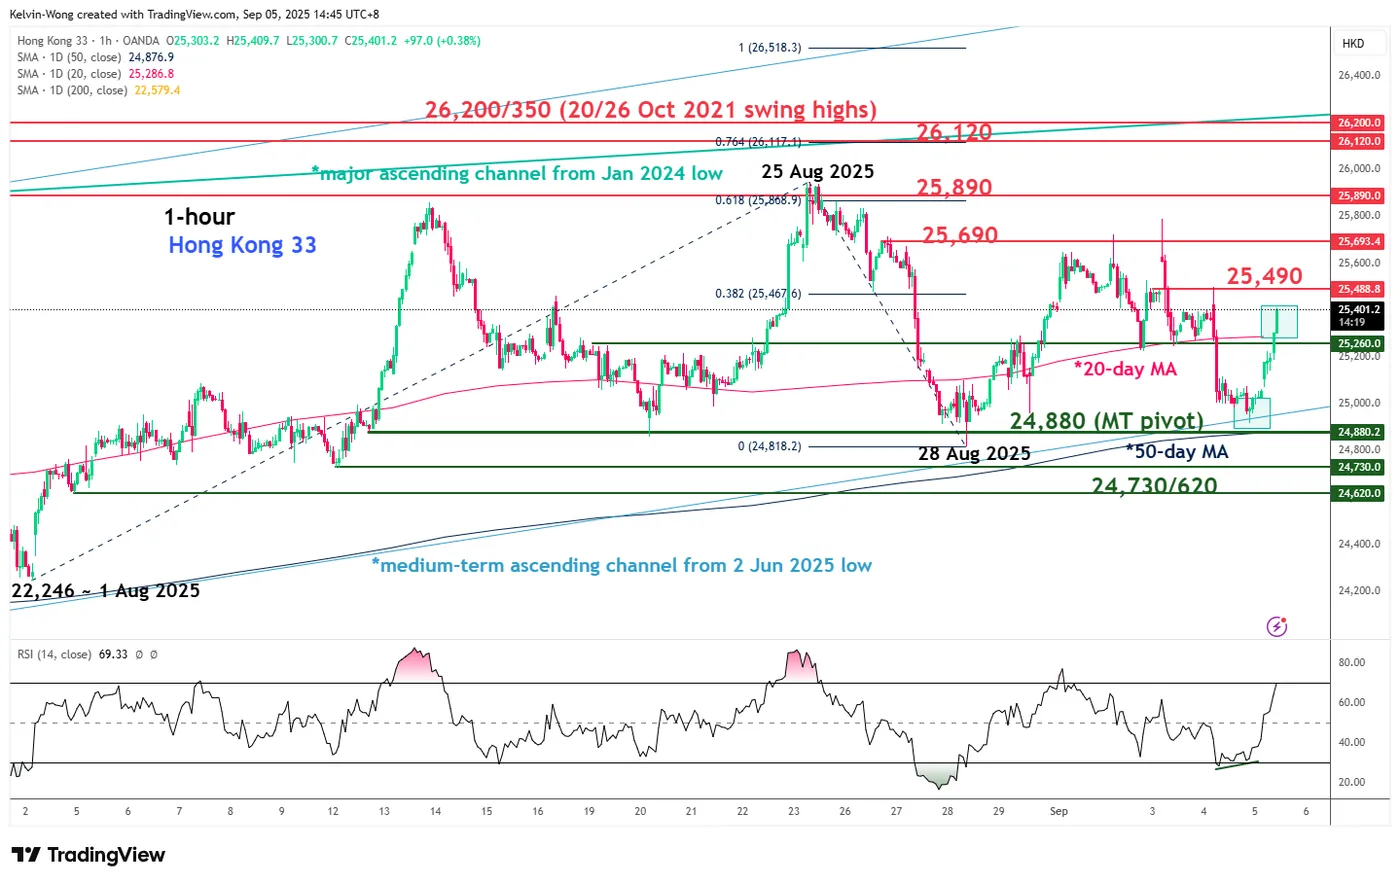
Fig. 3: Hong Kong 33 CFD Index minor trend as of 5 Sep 2025 (Source: TradingView)
Preferred trend bias (1-3 days)
The minor corrective decline from the 25 August 2025 high to the 28 August 2025 low of the Hong Kong 33 CFD Index is likely to have ended where a potential fresh bullish impulsive up move is in progress.
Bullish bias above 24,880 key medium-term pivotal support for the Hong Kong 33 CFD Index. A clearance above 25,490 intermediate resistances sees the next resistances coming in at 25,690, 25,890, and 26,120 in the first step (see Fig. 3).
Key elements
- The 24,880 key medium-term pivotal support on the Hong Kong 33 CFD Index is defined by the rising 50-day moving average, the lower boundary of the medium-term ascending channel from 2 June 2025 low, and the 61.8% Fibonacci retracement of the prior short-term bullish impulsive up move sequence from 1 August 2025 low to 25 August 2025 high.
- Today’s price actions of the Hong Kong 33 CFD Index have reintegrated back above the 20-day moving average, now acting as an intermediate support at 25,260.
- The hourly RSI momentum indicator of the Hong Kong 33 CFD Index has flashed out a bullish divergence condition at its oversold zone seen on Thursday’s US session, 4 September.
Alternative trend bias (1 to 3 days)
A break below the 24,880 key support jeopardizes the medium-term uptrend phase of the Hong Kong 33 CFD Index for an extension of the corrective decline to expose the next support zone of 24,730/24,620 in the first step.
