


Is the trend still our friend on NZD/JPY?
The pair is hitting a ceiling at its channel top but could still find buyers at the nearby correction levels.
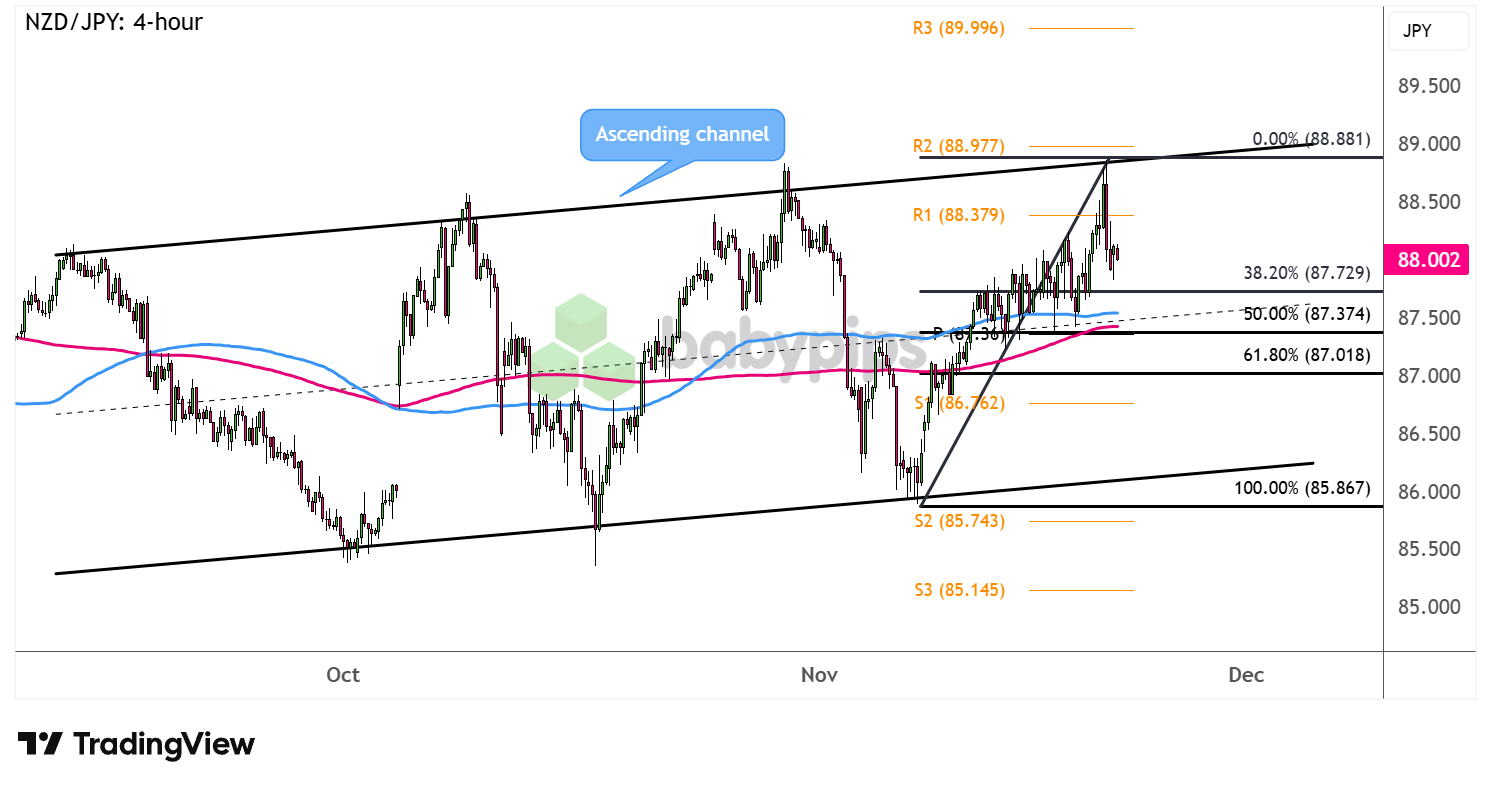
Take a look at these inflection points on the 4-hour time frame!

NZD/JPY 4-hour Forex Chart by TradingView
Expectations of stimulus from Japan have been dragging the yen lower for the most part of November while improving risk sentiment has propped the Kiwi up.
However, NZD/JPY hit a roadblock at the top of its ascending channel as risk assets suffered a sharp reversal on persistent AI valuation concerns.
Can the pair still get back on its feet when it dips to nearby support levels?
Remember that directional biases and volatility conditions in market price are typically driven by fundamentals. If you haven’t yet done your homework on the New Zealand dollar and the Japanese yen, then it’s time to check out the economic calendar and stay updated on daily fundamental news!
NZD/JPY is closing in on the 38.2% Fibonacci retracement level near the mid-channel area of interest which might be enough to convince Kiwi bulls to charge again.
A larger correction could reach the 50% Fib in line with the pivot point (87.36) and the dynamic support at the moving averages while the 61.8% level around the 87.00 major psychological mark could be the line in the sand for a pullback.
Keep your eyes peeled for reversal candlesticks at these levels that could point to a possible bounce back up to bullish targets around R1 (88.38) then R2 (88.97) near the channel resistance and the 89.00 major psychological handle.
Long red candlesticks falling through the Fib levels and the channel bottom near the 86.50 minor psychological mark, on the other hand, could suggest that a major reversal is in order.
Whichever bias you end up trading, don’t forget to practice proper risk management and stay aware of top-tier catalysts that could influence overall market sentiment!
Disclaimer:
Please be aware that the technical analysis content provided herein is for informational and educational purposes only. It should not be construed as trading advice or a suggestion of any specific directional bias. Technical analysis is just one aspect of a comprehensive trading strategy. The technical setups discussed are intended to highlight potential areas of interest that other traders may be observing. Ultimately, all trading decisions, risk management strategies, and their resulting outcomes are the sole responsibility of each individual trader. Please trade responsibly.
