


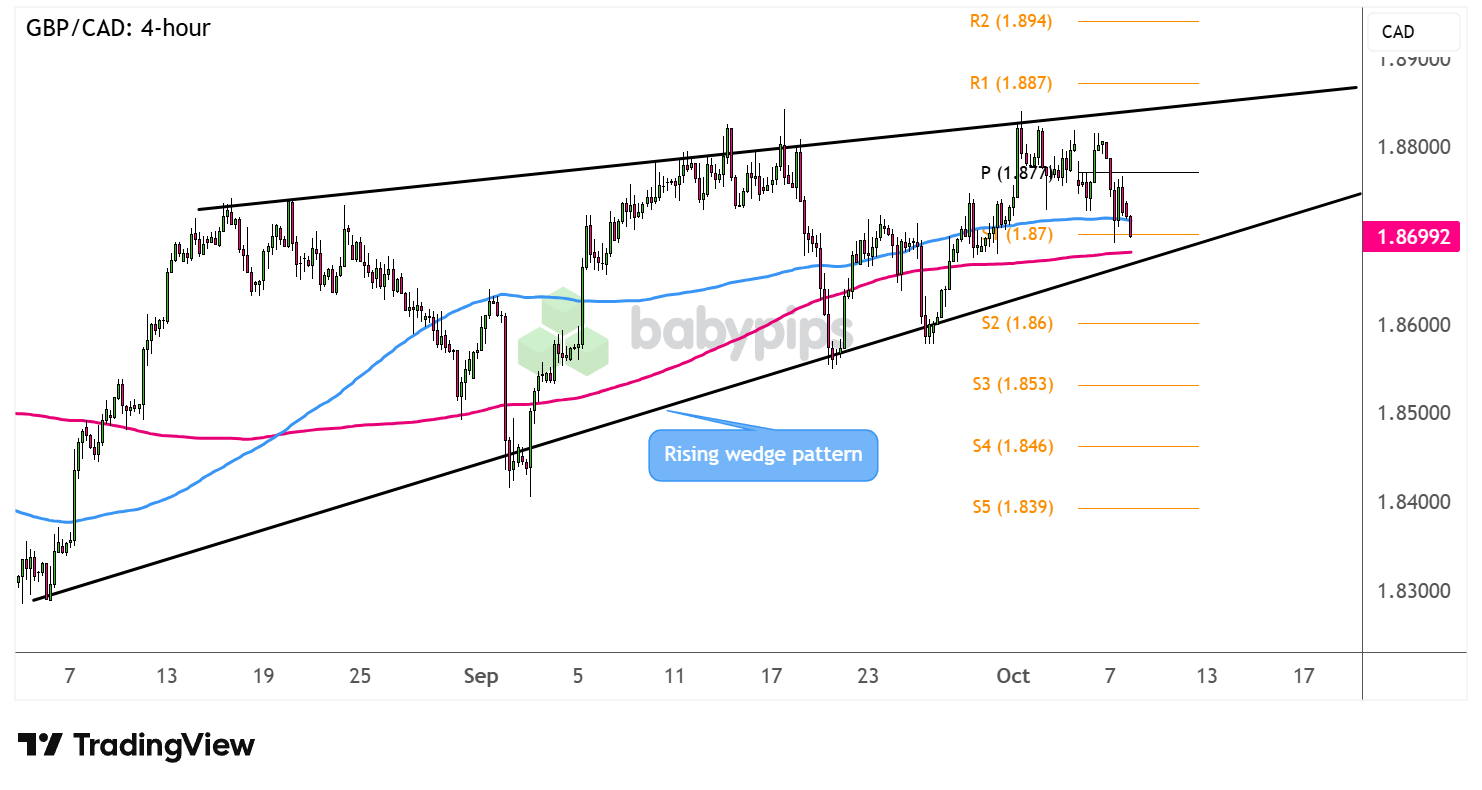
This sterling pair has formed higher lows and slightly higher highs to consolidate inside a rising wedge pattern on its 4-hour chart.
Are we about to see a breakdown soon?

The Canadian dollar has been cruising lower for nearly a couple of months already, as the currency appears to have been taking cues from its North American buddy, the U.S. dollar, while also reeling from back-to-back employment report misses.
At the same time, weakening crude oil prices on account of OPEC+ production boost rumors in the previous weeks also dragged the oil-related currency further south.
On the flip side, a more neutral Bank of England policy bias has allowed sterling to cruise higher, especially as U.K. data points have more or less reflected steady economic progress.
Can GBP/CAD resume its climb when it tests the wedge support?
Remember that directional biases and volatility conditions in market price are typically driven by fundamentals. If you haven’t yet done your fundie homework on the British pound and the Canadian dollar, then it’s time to check out the economic calendar and stay updated on daily fundamental news!
Price is already closing in on the bottom of the chart pattern around S1 (1.8700) and a major psychological mark, which also happens to line up with the 200 SMA dynamic inflection point.
The 100 SMA is above this slower-moving SMA, suggesting that the path of least resistance is to the upside or that support is more likely to hold than to break. If so, GBP/CAD could set its sights back on the upside targets at the pivot point (1.8770) or the wedge resistance near R1 (1.8870).
Just be sure to watch out for long red candlesticks closing below the wedge bottom, as a breakdown could take it down to the next support zones at S2 (1.8600) then S3 (1.8530).
Whichever bias you end up trading, don’t forget to practice proper risk management and stay aware of top-tier catalysts that could influence overall market sentiment.
Disclaimer:
Please be aware that the technical analysis content provided herein is for informational and educational purposes only. It should not be construed as trading advice or a suggestion of any specific directional bias. Technical analysis is just one aspect of a comprehensive trading strategy. The technical setups discussed are intended to highlight potential areas of interest that other traders may be observing. Ultimately, all trading decisions, risk management strategies, and their resulting outcomes are the sole responsibility of each individual trader. Please trade responsibly.
