

 Retesting Broken Neckline")

Missed the double top breakdown on bitcoin?
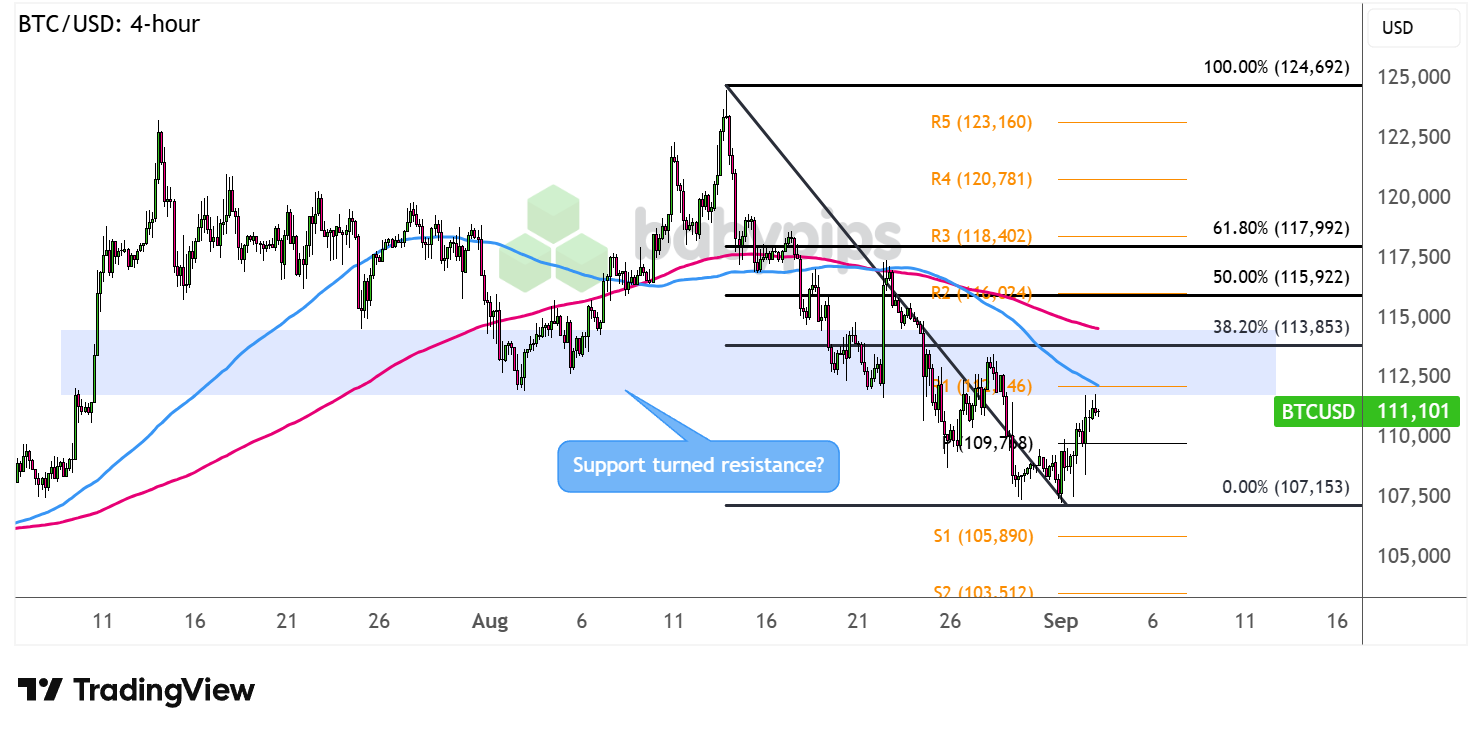
Price is now back to testing the former support zone, which could hold as resistance moving forward.
Take a look at these inflection points on the 4-hour time frame:

Bitcoin (BTC/USD) 4-hour Chart by TradingView
BTC/USD recently fell through support at the $112,500-$115,000 zone, suggesting a potential reversal from the uptrend earlier in the year.
Price is finding a floor around the $107,000 region, though, and it looks like a correction to the area of interest is taking place.
Will it hold as resistance from here?
Remember that directional biases and volatility conditions in market price are typically driven by fundamentals. If you haven’t yet done your homework on Bitcoin and the U.S. dollar, then it’s time to check out the economic calendar and stay updated on daily fundamental news!
Bitcoin is closing in on R1 ($112,146) just below the 38.2% Fibonacci retracement level but could still go for a larger pullback to the 50% Fib that lines up with R2 ($116,084) to gather more bearish energy.
Note that the 100 SMA is below the 200 SMA to hint that the path of least resistance is to the downside or that the selloff is more likely to gain traction than to reverse. In that case, look out for a continuation of the drop to the swing low or the pivot point level ($109,768) then to S1 ($105,890) if bearish pressure picks up.
On the other hand, a continued climb past the Fibs and R3 ($118,402) could clear the way for another test of the record highs close to R5 ($123,160).
Whichever bias you end up trading, don’t forget to practice proper risk management and stay aware of top-tier catalysts that could influence overall market sentiment!
Disclaimer:
Please be aware that the technical analysis content provided herein is for informational and educational purposes only. It should not be construed as trading advice or a suggestion of any specific directional bias. Technical analysis is just one aspect of a comprehensive trading strategy. The technical setups discussed are intended to highlight potential areas of interest that other traders may be observing. Ultimately, all trading decisions, risk management strategies, and their resulting outcomes are the sole responsibility of each individual trader. Please trade responsibly.
This content is strictly for informational purposes only and does not constitute as investment advice. Trading any financial market involves risk. Please read our Risk Disclosure to make sure you understand the risks involved.
