


The Australian dollar is right back at a key inflection point that acted as solid support at least three times in the past few weeks.
Will the bulls step in to defend this level again?
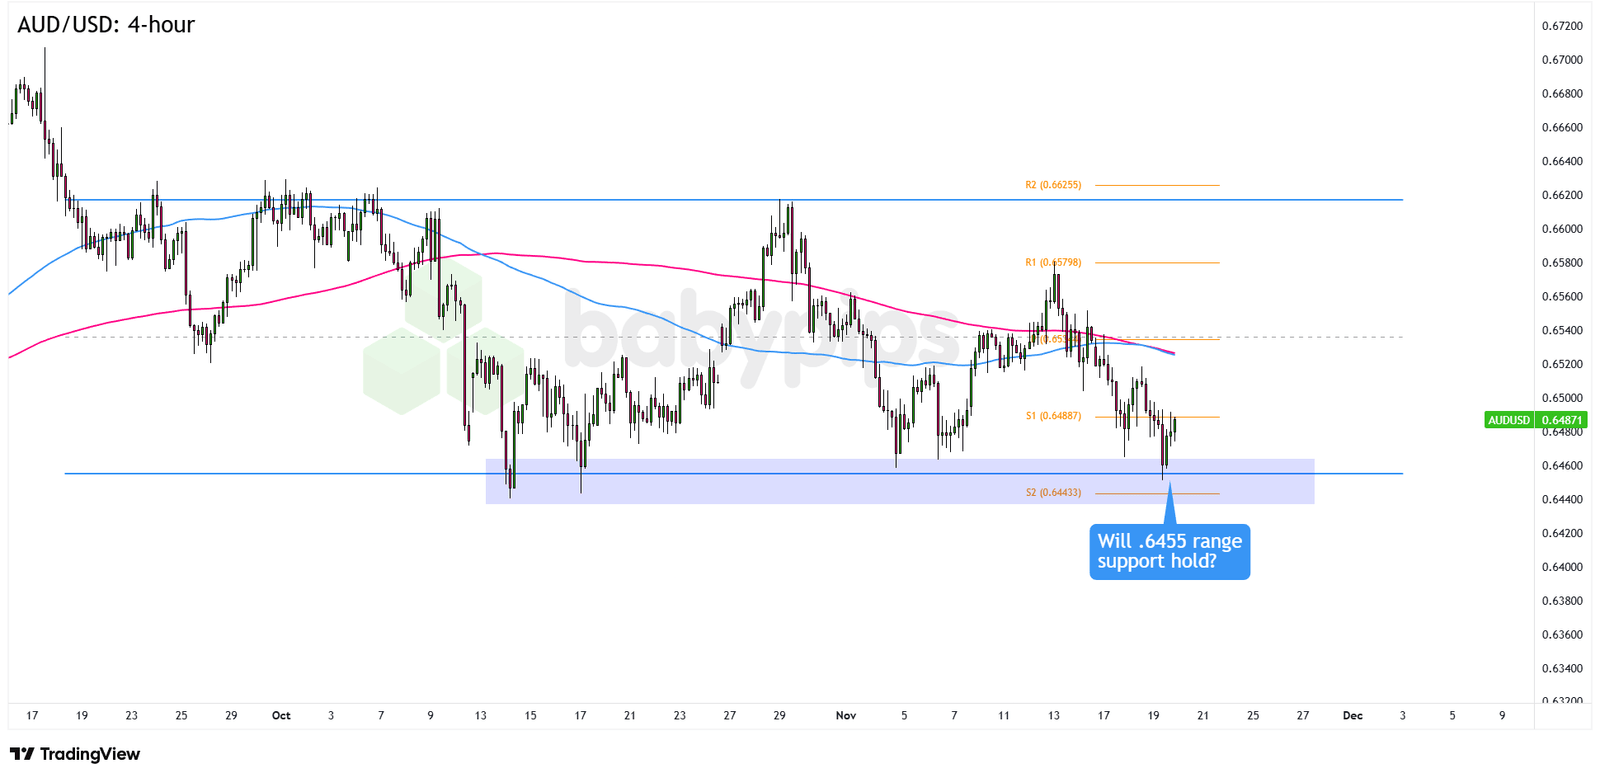
Check out AUD/USD’s 4-hour chart!

AUD/USD 4-hour Forex Chart by TradingView
China-Japan relations jitters, shaky gold prices, and fading hopes for quick Fed rate cuts have taken some of the shine off market risk appetite, and that has kept demand for the Australian dollar on the quiet side in recent sessions.
The U.S. dollar has enjoyed the opposite treatment, getting a lift from calmer Fed expectations and a general lean toward safety.
But that was earlier this week. Will the tides finally turn in favor of the Aussie in the days ahead?
Remember that directional biases and volatility conditions in market price are typically driven by fundamentals. If you haven’t yet done your homework on the Australian dollar and the U.S. dollar, then it’s time to check out the economic calendar and stay updated on daily fundamental news!
AUD/USD has been knocked around inside the .6450 to .6620 range since late September. The pair is now back near the support, hovering just above the .6450 area after getting pushed down from resistance at .6580.
What makes the .6450 range support zone interesting today is that it sits right above the S2 Pivot Point at .6443, and this zone has not given way as support since mid-October.
If we start to see bullish candles and steady trading above .6500, AUD/USD could make another run toward the .6550 mid-range area or even the .6620 previous highs.
But if the pair keeps sliding and holds consistently below the .6450 range support, sellers could take control and press for a downside break that sends AUD/USD toward the .6400 psychological level or even the .6350 inflection points.
Whichever bias you end up trading, don’t forget to practice proper risk management and stay aware of top-tier catalysts that could influence overall market sentiment!
Disclaimer:
Please be aware that the technical analysis content provided herein is for informational and educational purposes only. It should not be construed as trading advice or a suggestion of any specific directional bias. Technical analysis is just one aspect of a comprehensive trading strategy. The technical setups discussed are intended to highlight potential areas of interest that other traders may be observing. Ultimately, all trading decisions, risk management strategies, and their resulting outcomes are the sole responsibility of each individual trader. Please trade responsibly.
