


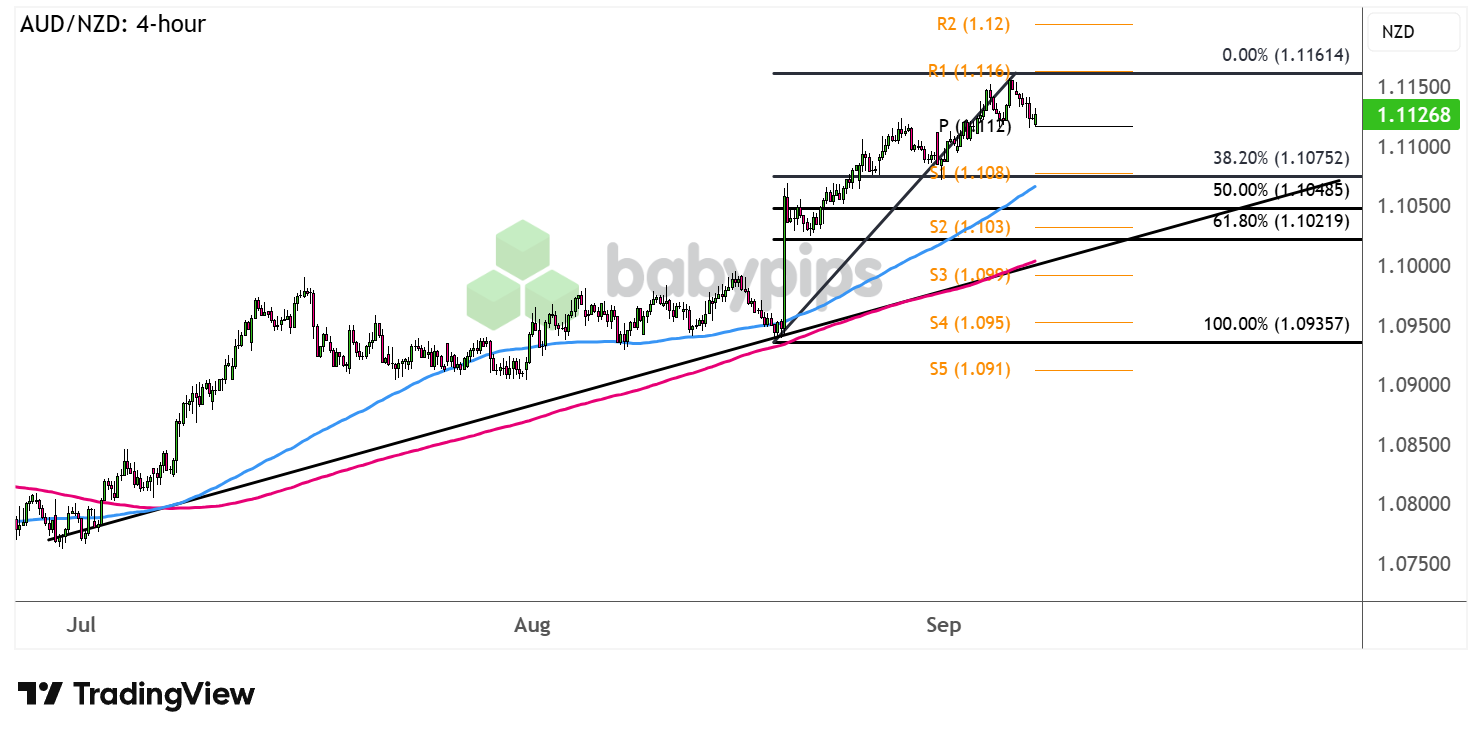
AUD/NZD has been cruising higher with its rising lows connected by an ascending trend line on its 4-hour chart.
Is it about to go in correction mode to gather more bullish energy soon?

Improving economic data has been propping the Aussie higher over the past few weeks, as strong CPI and GDP figures appear to have dampened immediate RBA easing hopes.
Meanwhile, the Kiwi seems to be on the back foot as risk aversion from Chinese regulatory concerns and persistent global trade jitters are weighing on the higher-yielding commodity currency.
Can AUD/NZD sustain its uptrend from here?
Remember that directional biases and volatility conditions in market price are typically driven by fundamentals. If you haven’t yet done your homework on the New Zealand dollar and the Australian dollar, then it’s time to check out the economic calendar and stay updated on daily fundamental news!
The pair looks like it’s running out of steam on its latest rally, finding resistance at R1 (1.1160) and possibly gearing up for a pullback to nearby support levels.
The Fibonacci retracement tool shows where buyers could be waiting. The 38.2% level lines up neatly with S1 (1.1080) then the 50% Fib is near the 1.1050 minor psychological mark and 100 SMA dynamic inflection point. A larger correction could reach the 61.8% level close to the rising trend line and S2 (1.1020).
Keep your eyes peeled for reversal candlesticks at these levels since a bounce could take AUD/NZD back up to the swing high or to the next upside target at R2 (1.1200).
Note that the 100 SMA is above the 200 SMA to suggest that the path of least resistance is to the upside or that the climb is more likely to gain traction than to reverse, but a break below the trend line could suggest that selling pressure is building up for a reversal.
Whichever bias you end up trading, don’t forget to practice proper risk management and stay aware of top-tier catalysts that could influence overall market sentiment!
Disclaimer:
Please be aware that the technical analysis content provided herein is for informational and educational purposes only. It should not be construed as trading advice or a suggestion of any specific directional bias. Technical analysis is just one aspect of a comprehensive trading strategy. The technical setups discussed are intended to highlight potential areas of interest that other traders may be observing. Ultimately, all trading decisions, risk management strategies, and their resulting outcomes are the sole responsibility of each individual trader. Please trade responsibly.
