


Key takeaways:
-
A Q1 2025 fractal and oversold market conditions suggest BTC could consolidate before retesting the $98,000 to $100,000 zone.
-
One analyst made a bold price prediction, suggesting that a rising wedge breakdown could open the door to a deeper correction, potentially reaching $30,000.
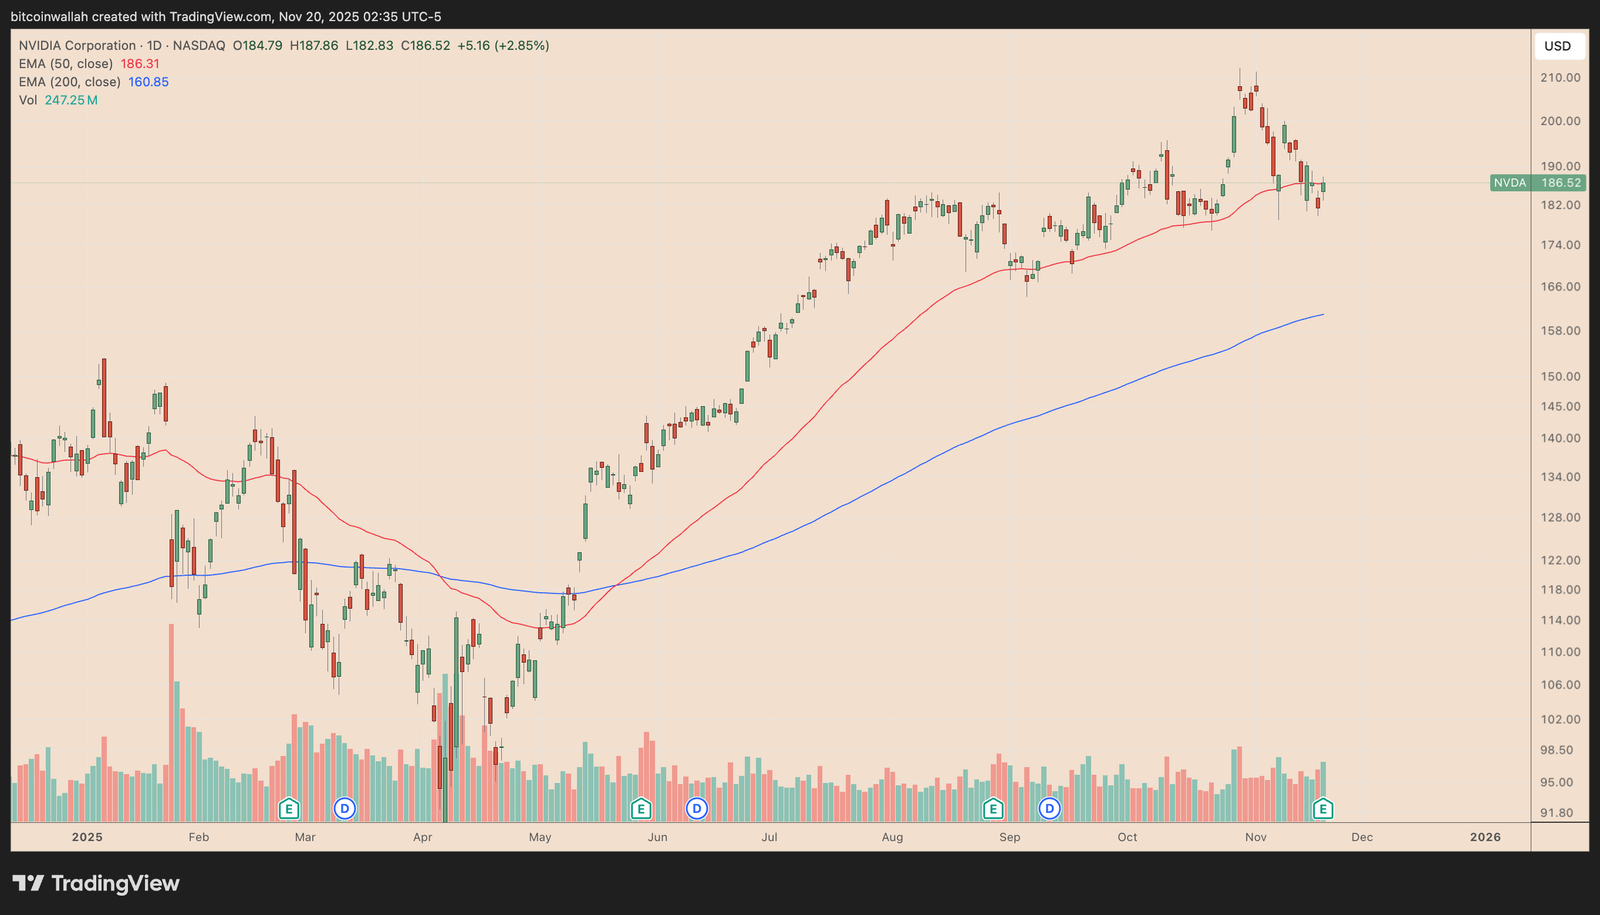
Bitcoin (BTC) jumped after Nvidia Corp.’s stronger-than-expected revenue outlook helped calm fears of an overheating AI bubble, but the gains quickly reversed as the Dow gave up a 700-point rally to turn negative and US stocks sold off. Bitcoin fell to a new monthly low of $86,400, and data suggest more downside could be on the way.
Bitcoin mirrors Q1’s bullish reversal fractal: Analyst
Bitcoin’s recent pullback is echoing the same bullish reversal structure that unfolded in Q1 2025, said analyst Cas Abbé.

Back then, BTC lost momentum near its fresh all-time high, slipped below a key support level, and decoupled from a rising stock market before bottoming out in a multi-week accumulation range.
Abbé’s chart below shows the pattern resurfaced almost identically in recent months, with the analyst adding that BTC will likely enter “consolidation between $85,000 to $100,000 for 3 to 4 weeks.”
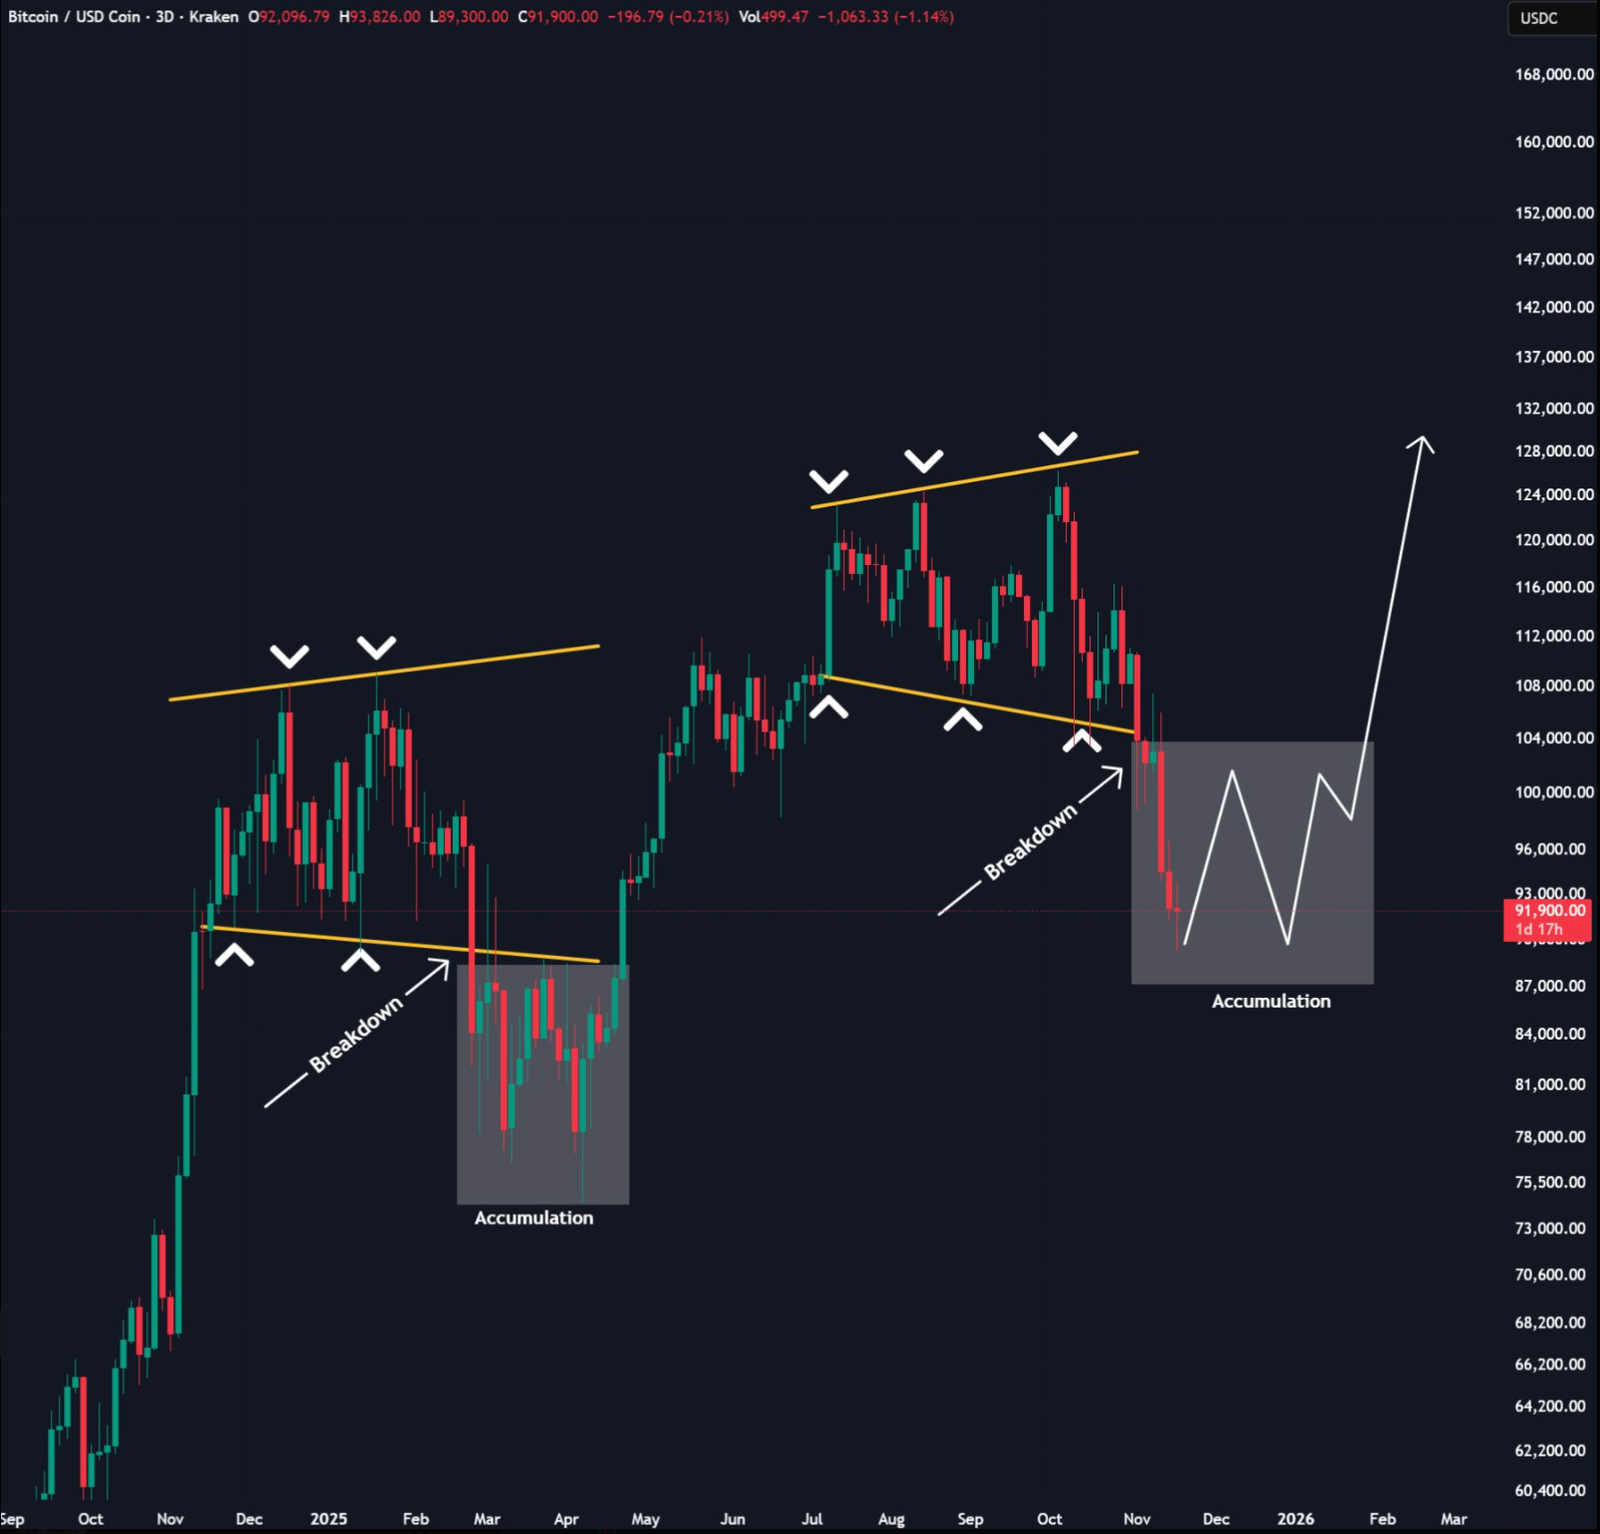
More importantly, both corrections were driven by broader macro fears.
In Q1 2025, the sell-off was sparked by the US tariff war. This time, the catalyst has been panic over a potential AI bubble, anxieties that weighed heavily on tech stocks and spilled into crypto before Nvidia’s upbeat revenue outlook helped calm markets.
The fractal raised Bitcoin’s odds of retesting $100,000 as resistance by year’s end.
Analyst BitBull supported the bullish reversal outlook, though his view leans more on the technical structure of Bitcoin’s descending channel and its deeply oversold conditions as of Thursday.
BTC traded near the lower boundary of this multi-week downtrend, an area that has repeatedly acted as an accumulation zone during previous corrections.
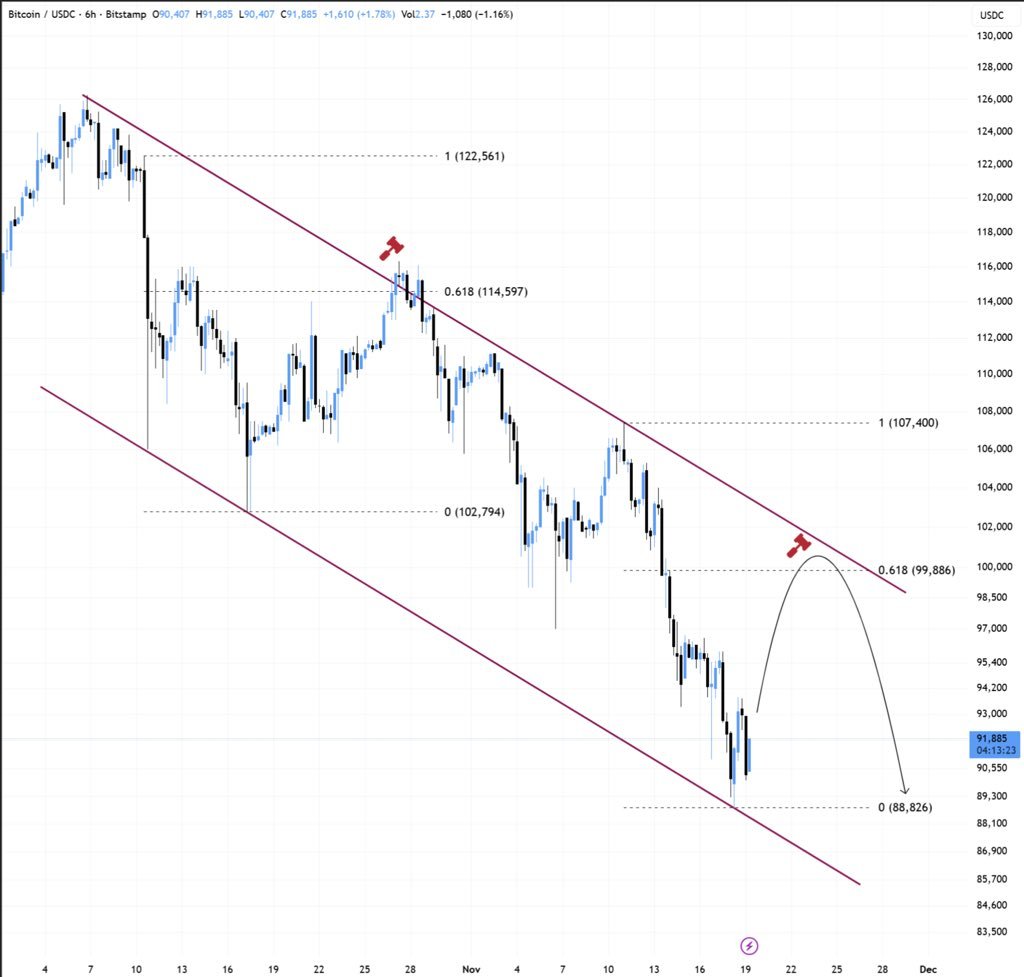
Additionally, Bitcoin’s weekly relative strength index (RSI) has dipped into oversold territory for the first time in months.
Related: $90K Bitcoin price is a ‘close your eyes and bid’ opportunity: Analyst
Together, BitBull argued, these signals mark potential local bottoms, adding that BTC “could rally toward $98,000 to 100,000” next.
Rising wedge breakdown flags $30,000 BTC price target
Analyst AlejandroBTC takes a far more bearish stance, noting that Bitcoin has officially broken down from the large rising wedge pattern he has been warning about for months.
In classical technical analysis, a rising wedge breakdown typically marks the end of a major trend, with the measured move indicating a significant decline.
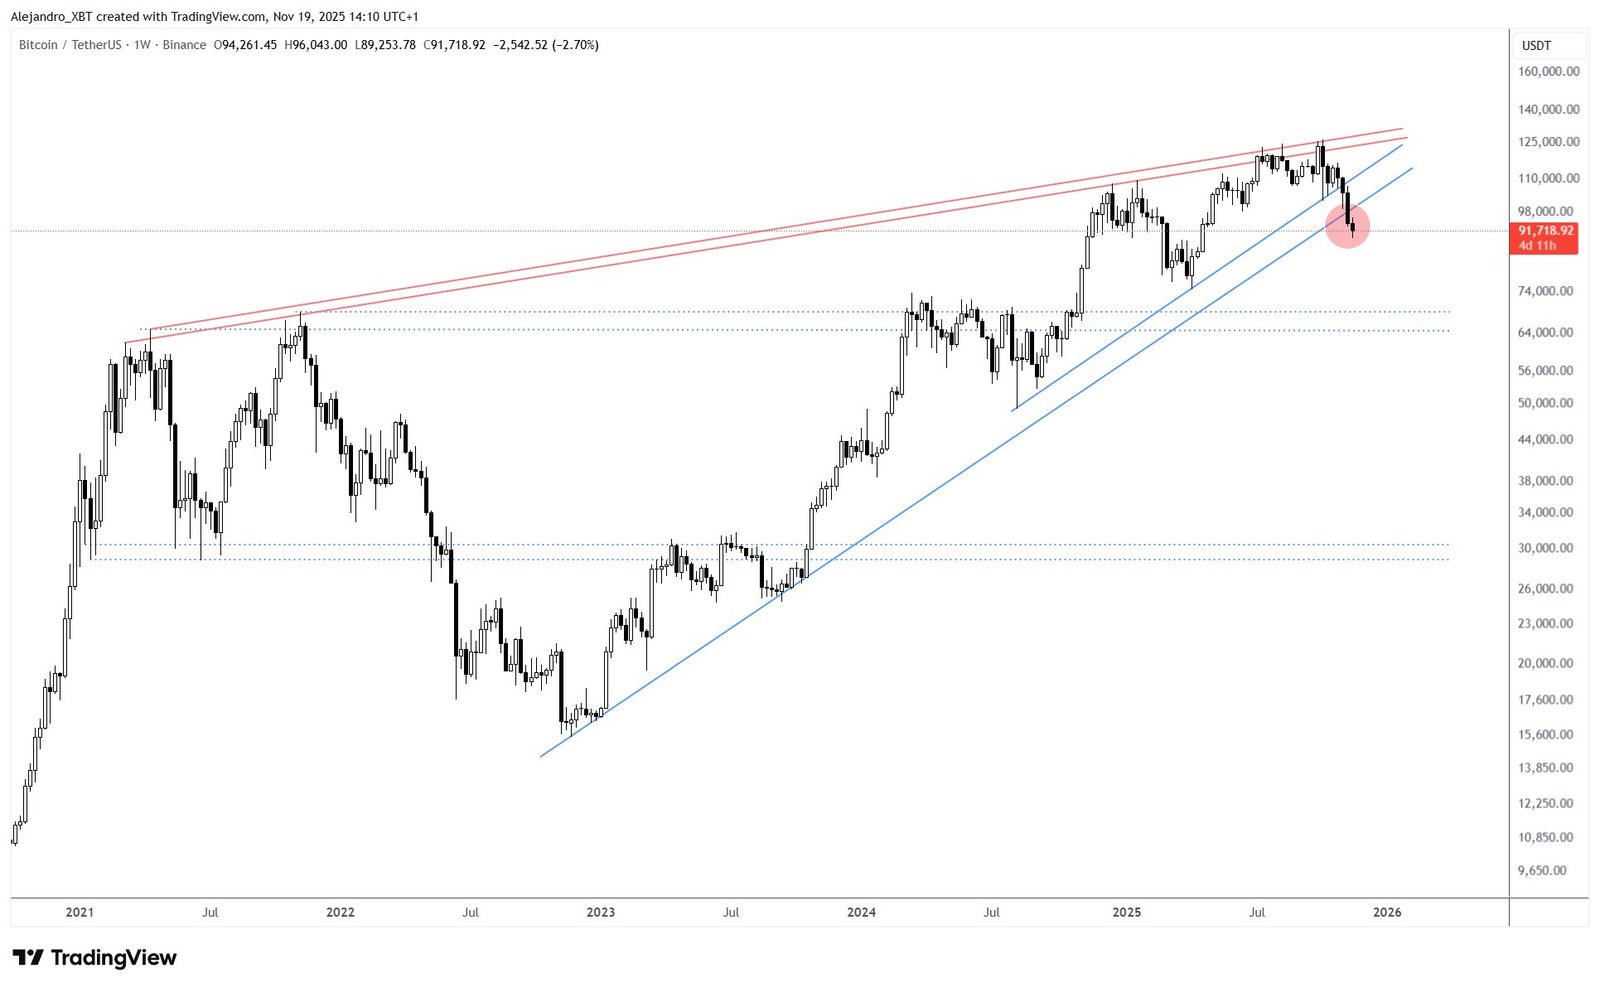
In this case, AlejandroBTC argues the structure projects a long-term target near the $30,000 region, a level that aligns with multiple historical support zones on the weekly chart.
This article does not contain investment advice or recommendations. Every investment and trading move involves risk, and readers should conduct their own research when making a decision.
