


Key takeaways:
-
Bitcoin broke $114,000 as data showed PPI inflation cooled sharply in August.
-
Traders believe the data could push the Federal Reserve to cut rates in September.
-
Long-term onchain trends show short-term turbulence occurring after Fed rate cuts, then longer-term upside.
Bitcoin (BTC) surged above $114,000 for the first time since Aug. 24, extending its recent recovery as US inflation data came in far cooler than expected. The move follows the release of the August Producer Price Index (PPI), which dropped to 2.6% year-over-year versus forecasts of 3.3%. Core PPI, which strips out food and energy, fell to 2.8%, well below the 3.5% consensus.

On a monthly basis, PPI even turned negative, marking only the second contraction since March 2024, according to the Kobeissi newsletter. Adding to the dovish tone, inflation figures from July were revised lower as well, with headline PPI adjusted to 3.1% from 3.4% and core PPI to 3.4% from 3.7%. In addition to the historic US jobs data revision earlier this week, which erased 911,000 jobs from the past 12 months, markets are viewing interest rate cuts as increasingly imminent.
Market analyst Skew noted that producer inflation trends often lag behind those of the Consumer Price Index (CPI) by one to three months. This means sticky CPI readings could still appear in the short run, though the broader trajectory points to cooling inflation into Q4. While the PPI slowdown is encouraging, hedge flows may continue until CPI confirms the easing trend.
Related: Bitcoin must hit $104K to repeat past bull market dips: Research
Bitcoin’s historical reaction to Fed rate cuts
With Federal Reserve interest rate cuts looking extremely likely, Bitcoin’s history shows a consistent pattern of turbulence followed by upside. Two onchain metrics, Market Value to Realized Value (MVRV) and Whale Ratio, shed further light.
MVRV compares Bitcoin’s market capitalization to its realized capitalization (the aggregate value at which coins last moved). When MVRV hovers near 1, BTC is typically undervalued, and levels near 3–4 suggest overheated valuations.
Meanwhile, Whale Ratio measures the share of large holder transactions in exchange flows, showing when whales are sending coins to sell or pulling them back for storage.
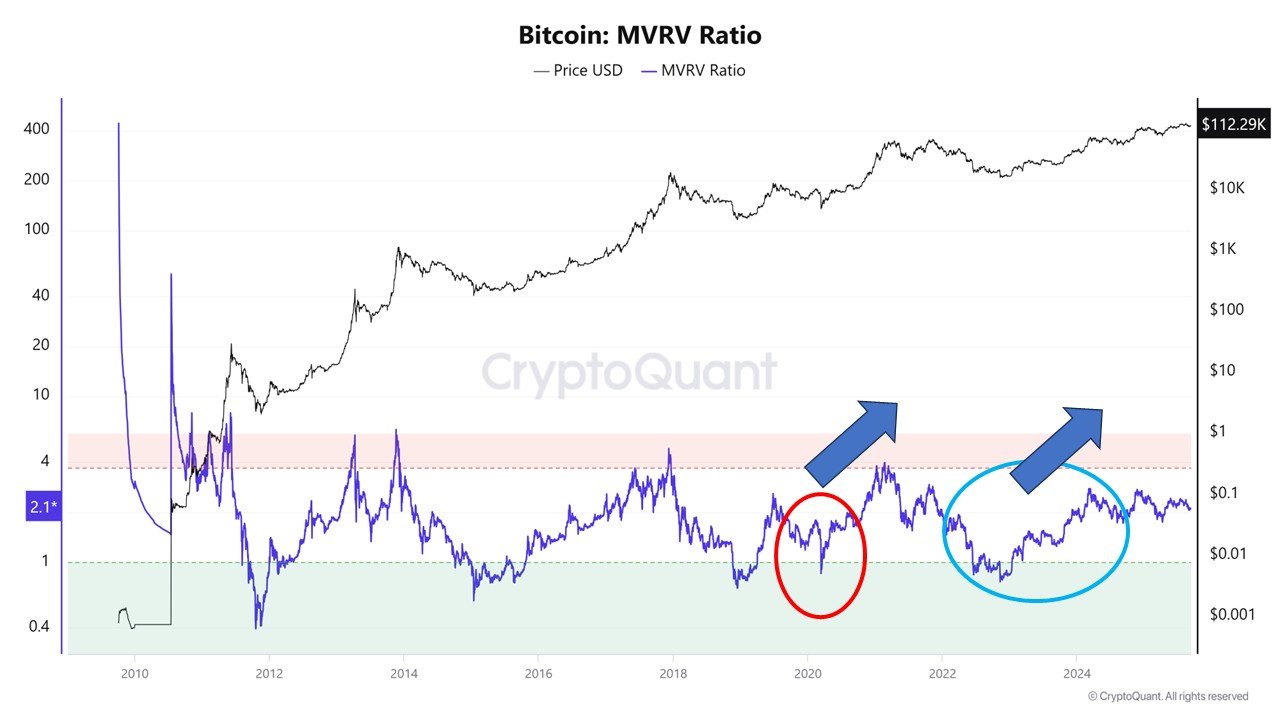
Data from CryptoQuant highlights that in March 2020, interest rate cuts sent MVRV collapsing toward 1 as panic wiped out investors’ speculative gains, while the Whale Ratio spiked on heavy whale selling.
As liquidity flooded in, the MVRV rebounded, and whales shifted to accumulation, fueling Bitcoin’s 2020–2021 bull run. A similar pattern repeated during the late 2024 easing cycle, when both indicators reflected short-term selling before stabilizing into another rally.
If history rhymes, Fed easing in 2025 could again bring initial volatility, but overall provide the liquidity backdrop for Bitcoin to approach new highs.
Related: Bitcoin traders cut risk over macro worries, but BTC market structure targets $120K
This article does not contain investment advice or recommendations. Every investment and trading move involves risk, and readers should conduct their own research when making a decision.
