


Key takeaways:
-
Bitcoin’s Cost Basis Distribution shows strong buyer support versus Ether’s weaker flows.
-
Coinbase and Binance netflows hint at a liquidity regime shift favoring reaccumulation.
-
BTC must break $113,650 to confirm a bullish trend, else risk a drop toward $100,000.
Bitcoin’s (BTC) spot market is flashing signs of a potential recovery rally. Data from Glassnode indicates BTC’s Cost Basis Distribution (CBD) shows a sharp divergence with Ether (ETH). The CBD is an onchain metric that identifies price levels where significant supply has been accumulated or distributed. While ETH flows remain sparse, Bitcoin spot activity is denser, with transactions clustering tightly across recent levels.

This density could indicate a strong buyer’s conviction, and in the past, it has provided more durable support than futures-driven momentum.
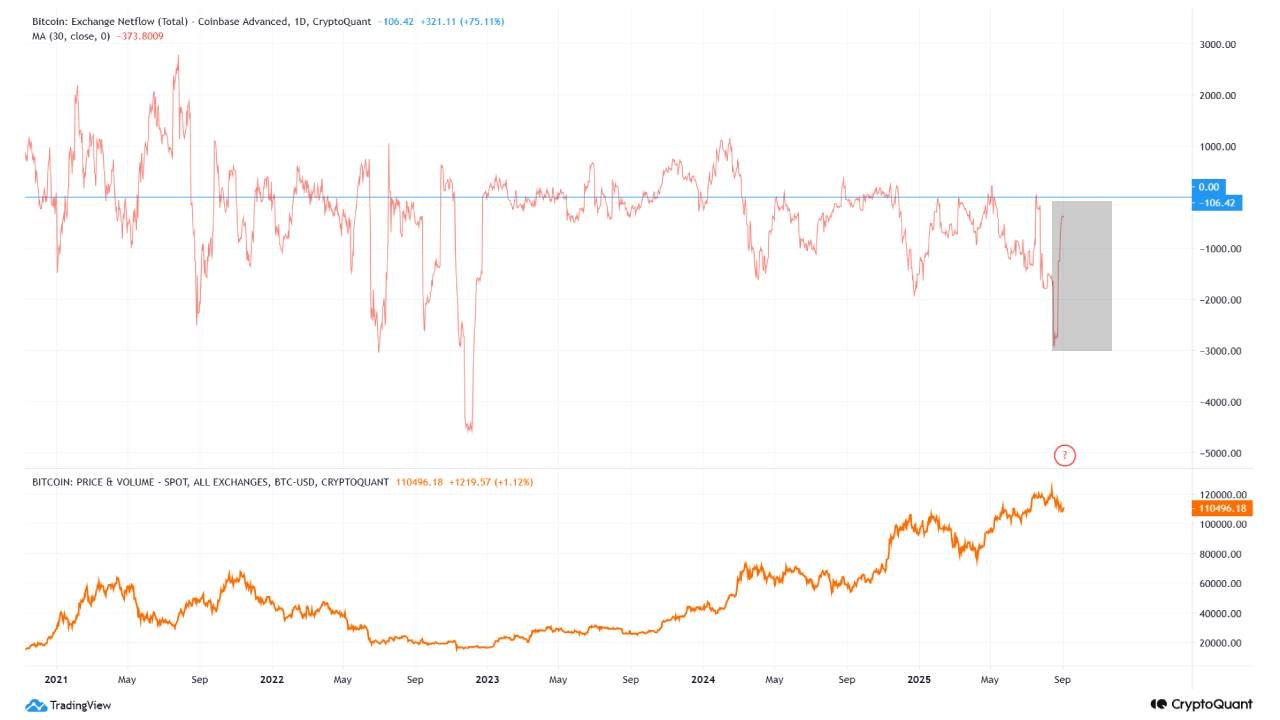
Exchange flows add weight to the thesis. A CryptoQuant quicktake post points out that Coinbase recorded a consistent netflow spike between Aug. 25–31, immediately after its 30-day simple moving average (SMA) hit the lowest level since early 2023. Sharp reversals from multi-year troughs often signal a regime shift in liquidity, whether via settlement restructuring or preparations for higher exchange activity.
Meanwhile, Binance saw its 30-day SMA netflow reach the highest since July 2024 on July 25 and Aug. 25, a level that historically coincided with reaccumulation phases before new local highs.
The simultaneous Coinbase trough and Binance peak point to meaningful reserve redistribution, potentially setting the stage for upside.
Long-term holder (LTH) spending or possible profit-taking has also accelerated in recent weeks, with the 14-day SMA trending higher. Yet activity remains within cycle norms and well below the October–November 2024 peaks, suggesting measured distribution rather than aggressive selling.
Related: How high can Bitcoin price go as gold hits record high above $3.5K?
Bitcoin eyes key breakout as $113,600 level comes into focus
Bitcoin (BTC) showed signs of resilience this week after dipping to $107,300 on Monday, a level that aligns closely with its short-term realized price, hinting at potential support. From that low price, BTC rebounded sharply, breaking above Monday’s $109,900 high during the New York trading session on Tuesday.
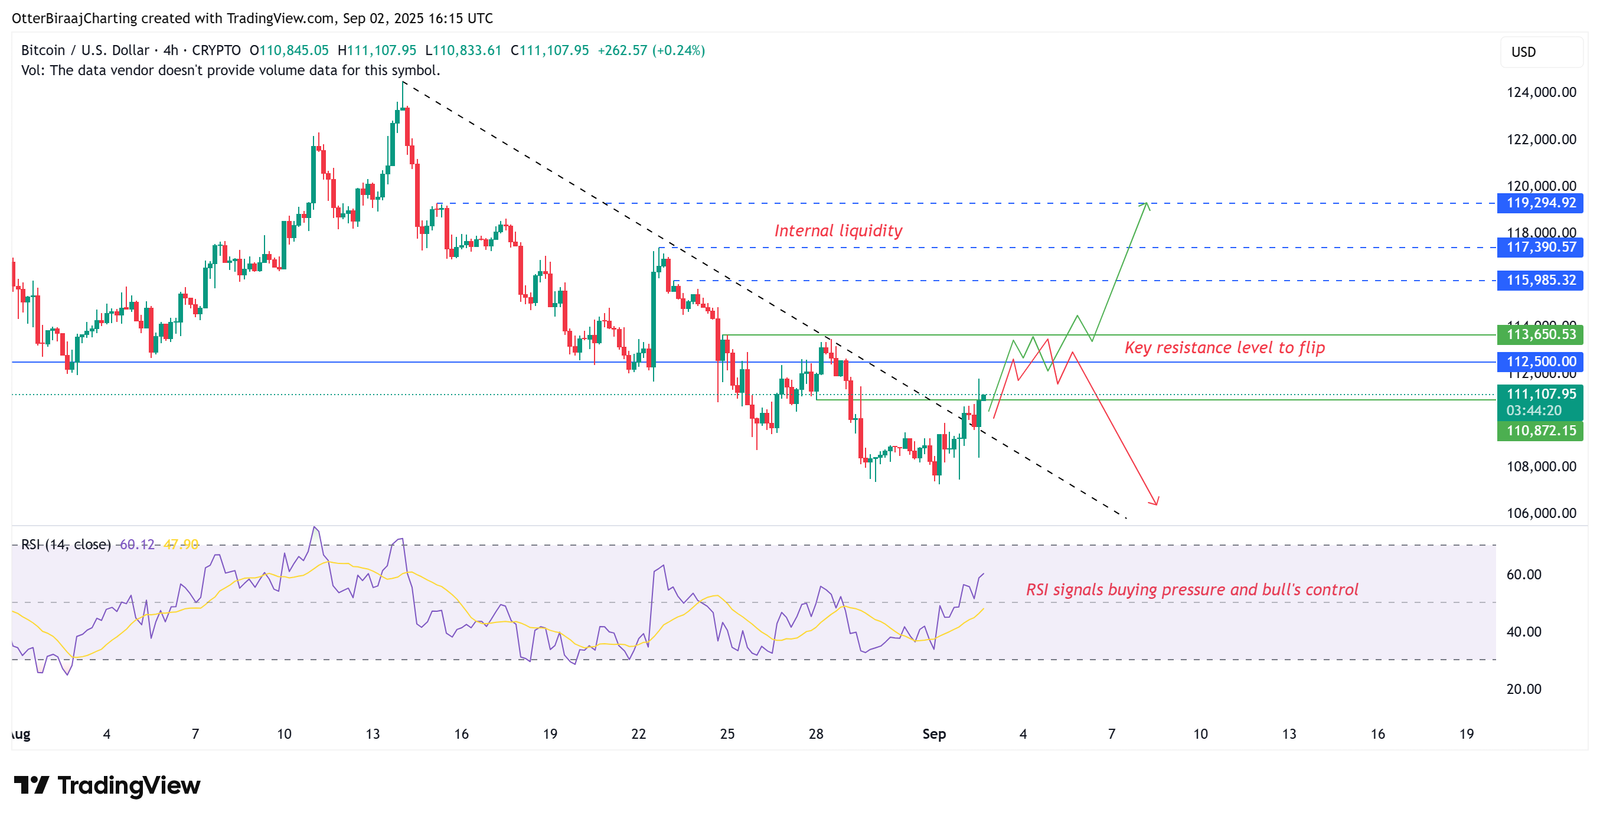
The move comes after a two-week corrective phase, with lower time frames such as the 15-minute and 1-hour charts now flashing a bullish break of structure. On the 4-hour chart, the relative strength index (RSI) has also reclaimed levels above 50, reinforcing the growing bullish conviction.
For the recovery to continue, Bitcoin must clear immediate resistance between $112,500 and $113,650. A decisive close above $113,650 would confirm a bullish break of structure on the daily chart and invalidate the descending trendline that has capped price action for the past two weeks. Such a breakout could open the path toward liquidity targets at $116,300, $117,500, and potentially $119,500.
However, traders should remain cautious given September’s bearish seasonality. A failed breakout or sustained weakness below $113,650 would leave BTC vulnerable, with downside targets extending toward the order block between $105,000 and $100,000.
Related: Bitcoin bulls charge at $112K as gold hits fresh all-time highs
This article does not contain investment advice or recommendations. Every investment and trading move involves risk, and readers should conduct their own research when making a decision.
