


Key takeaways:
-
The Bitcoin double bottom pattern may boost bullish momentum toward $110,000.
-
The CME gap near $104,000 could trigger a short-term retracement.
-
Stablecoin buildup and short-term holders’ stress hint at near-term volatility.
Bitcoin (BTC) staged a textbook double bottom pattern over the weekend, leading BTC to secure a bullish weekly close above its 50-week moving average. The formation coincided with the daily order block between $98,100 and $102,000, where BTC repeatedly tested the $100,000 zone before rebounding.

Following a bullish break of structure on the four-hour chart, Bitcoin now faces resistance near $111,300, a level that could be tested if short-term momentum holds. However, onchain data suggested this advance may not come as easily.
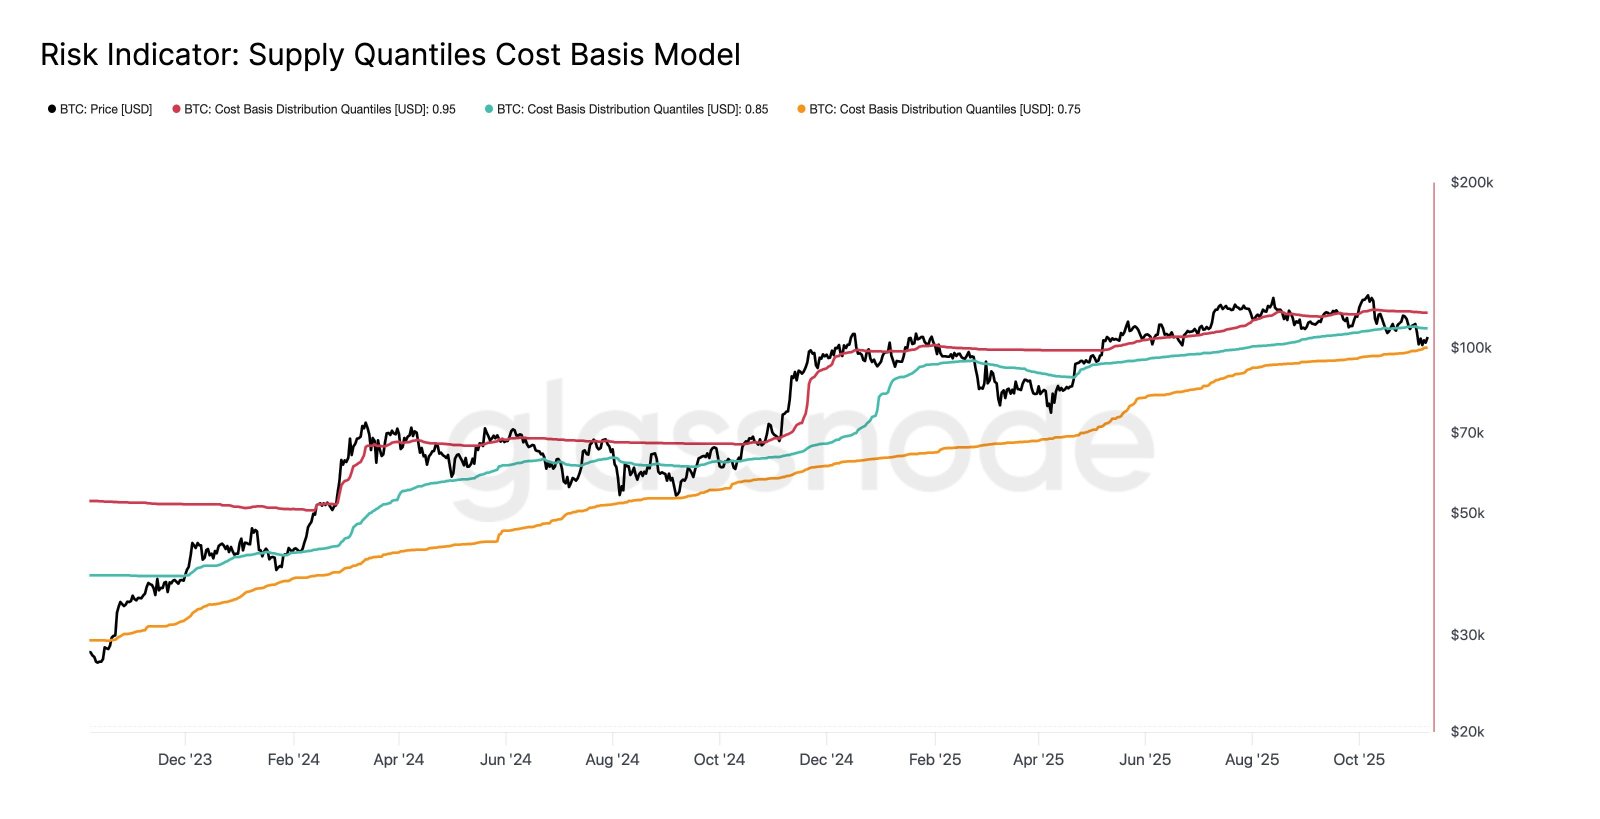
Glassnode explained that Bitcoin rebounded from the 75th percentile cost basis near $100,000. The next significant hurdle lies near the 85th percentile cost basis, roughly $108,500, a level that has historically acted as resistance during recovery moves. The percentile cost basis metric measures where the majority of investors acquired their BTC, effectively mapping the cost distribution across the market.
However, Cointelegraph noted a potential liquidity grab above $115,000, which aligns with a daily resistance level, with long-side liquidity near $100,000 exhausted.
Additionally, a CME gap between $103,100 and $104,000 remains a key short-term risk. CME gaps occur when Bitcoin’s weekend price movement creates a difference between Friday’s closing and Monday’s opening price on the Chicago Mercantile Exchange, and these gaps often get “filled” as traders revisit these levels, suggesting BTC may briefly retrace before resuming its uptrend.
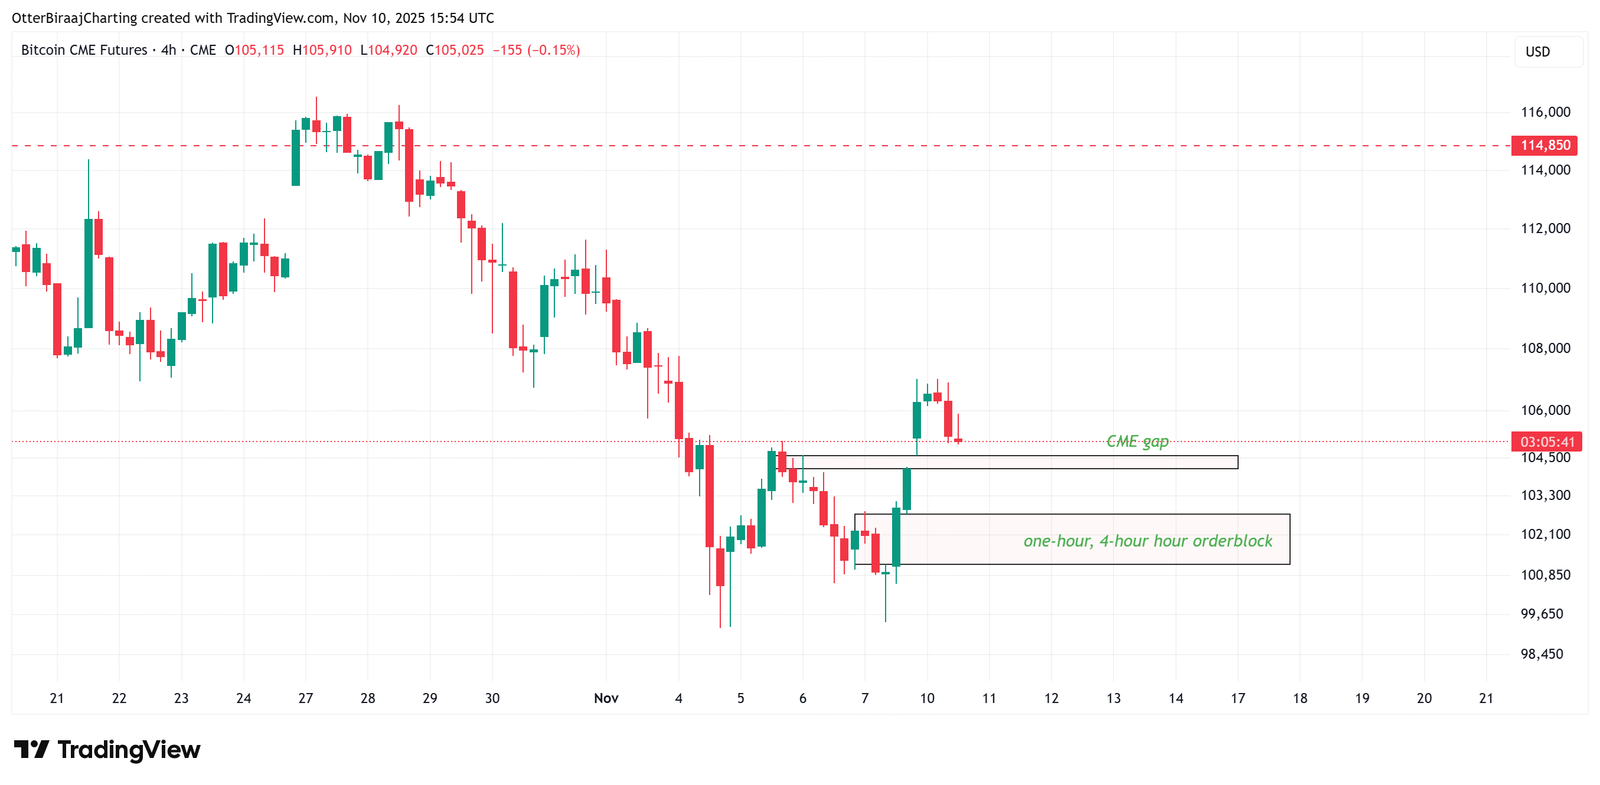
With liquidity and participation thinning out, BTC could revisit $101,000–$102,500, retesting the weekend’s one-hour and four-hour order blocks before making a decisive move higher.
Related: ‘Most hated bull run ever?’ 5 things to know in Bitcoin this week
Stablecoin strength could shape short-term BTC outlook
CryptoQuant data indicated the Stablecoin Supply Ratio (SSR) has plunged from above 18 earlier this year to 13.1, one of the lowest levels in 2025. The drop indicates rising stablecoin reserves relative to Bitcoin’s market cap, a sign of offchain liquidity accumulation awaiting a market signal.
Over the past month, SSR fell from 15 to 13 while BTC hovered near $105,000, hinting that buyers are waiting for confirmation before deploying capital.
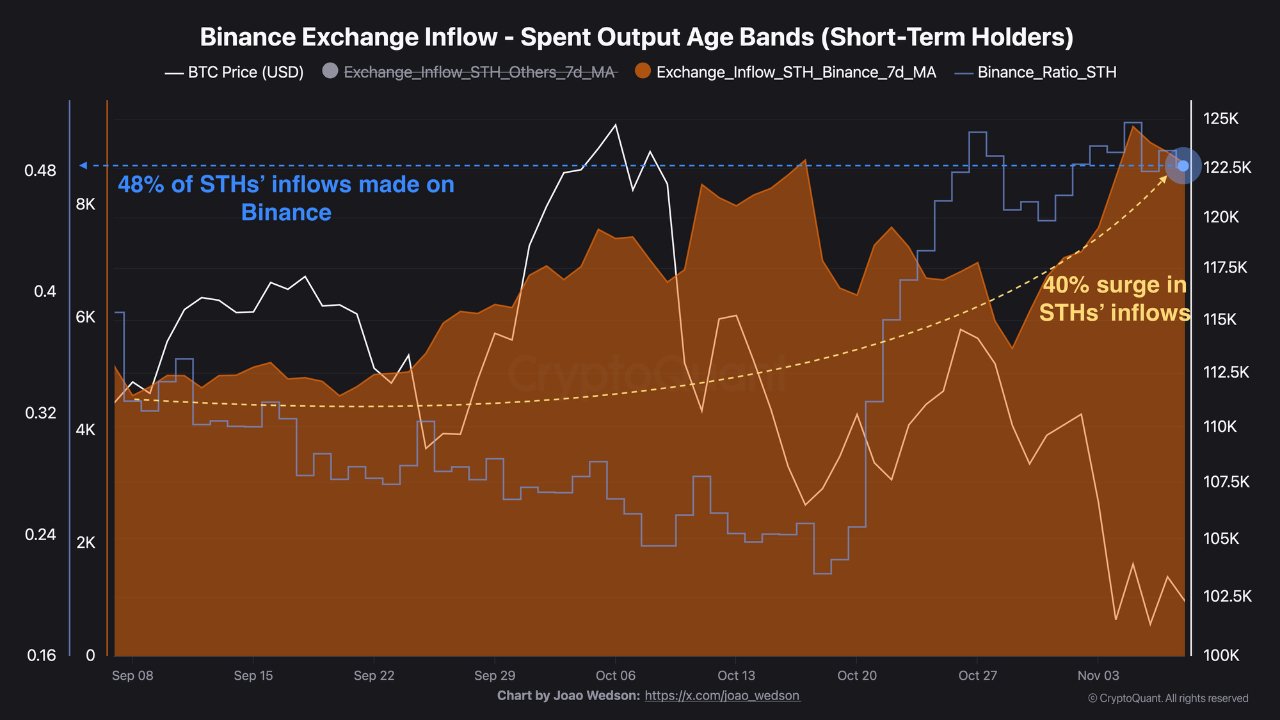
Conversely, crypto analyst Darkfost observed a sharp 40% rise in short-term holder (STH) inflows to Binance since September, up from 5,000 BTC to 8,700 BTC. With the realized price for STHs around $112,000, many remain underwater and are increasingly reactive to short-term volatility. This cohort’s selling pressure often precedes mid-cycle shakeouts before broader bullish continuations, adding a layer of short-term instability.
Related: Bitcoin, ETH ETFs see $1.7B outflow but whale buying softens the price impact
This article does not contain investment advice or recommendations. Every investment and trading move involves risk, and readers should conduct their own research when making a decision.
