


Key takeaways:
-
Bitcoin traded above short-term holder cost basis at $114,000, signaling recovering demand and potential for further gains.
-
Analysts said Bitcoin could continue its uptrend, with targets above $150,000.
Bitcoin (BTC) price reclaimed the $115,000 level on Monday, recouping some of the losses from Friday’s historic sell-off, which resulted in over $20 billion in centralized exchange liquidations.
The 10%-15% price drop left a mark on BTC’s technicals, but traders said that Bitcoin’s macro outlook remained bullish with $150,000 still in the cards.

Bitcoin recovers above key trendline
The BTC/USD pair was trading 8% above the $107,500 low reached on Friday, according to Cointelegraph Markets Pro and TradingView.
This recovery has seen BTC rise back above its short-term (STH) cost basis, suggesting possible higher gains.
Related: $120K or end of the bull market? 5 things to know in Bitcoin this week
STH cost basis, or realized price, represents the average acquisition price of BTC for investors who have held Bitcoin for less than 155 days.
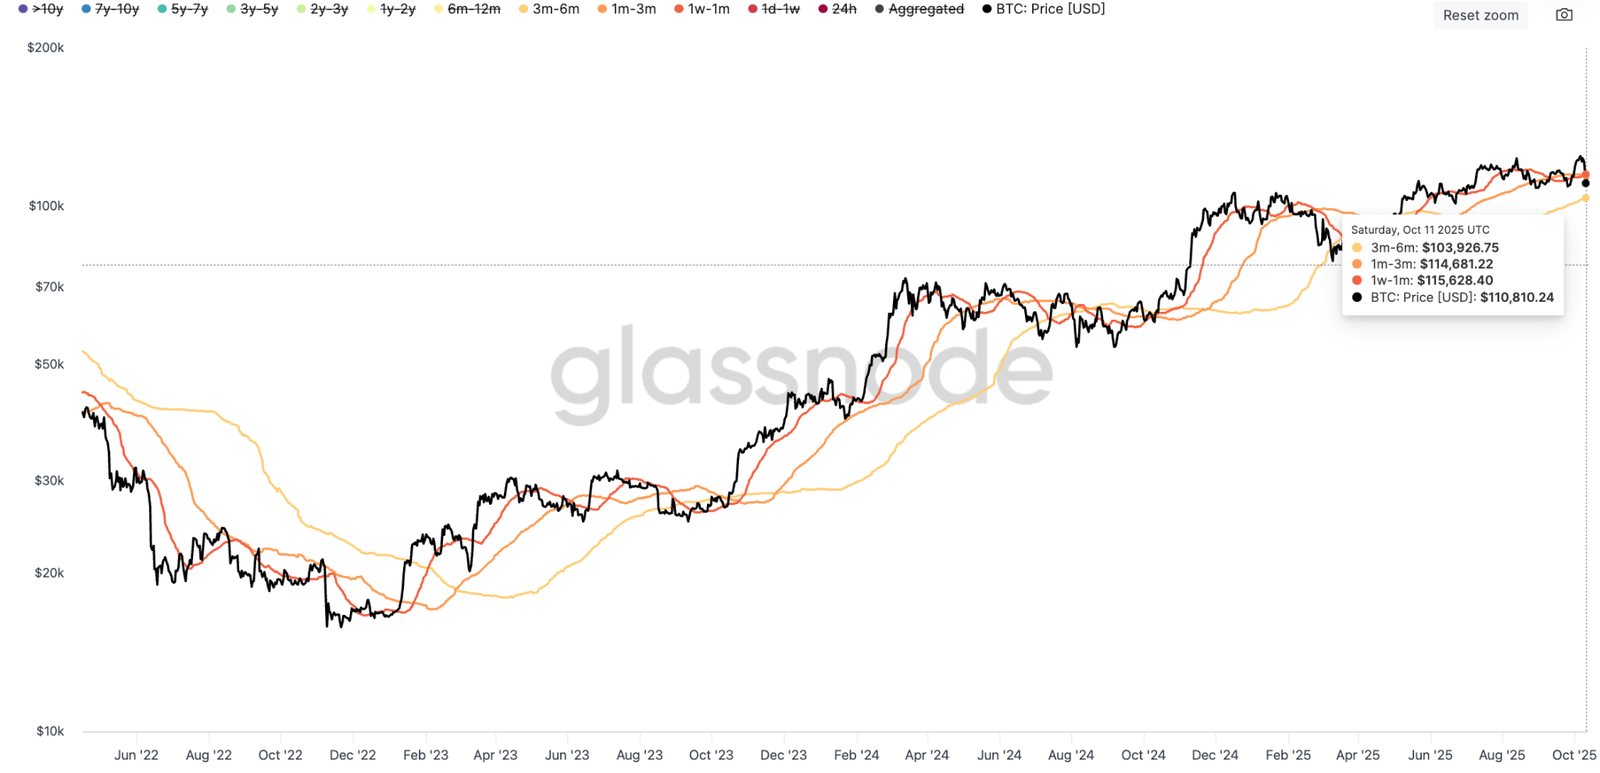
“BTC back above the STH cost basis of $114K,” said Frank Fetter, a quant analyst at investment firm Vibes Capital Management, adding:
“The show goes on.”
The STH cost basis trendline acts as support during Bitcoin bull market corrections, and reclaiming it boosts investor confidence that the BTC/USD pair may see further gains.
Additional data from Glassnode also highlighted that the cost basis of the one-week-to-one-month holders has crossed back above the one-month-to-three-month cost basis, signaling a rising momentum in demand and net capital inflows, as traders bought the dip.
Bitcoin’s uptrend remains intact
Bitcoin’s latest flash crash below $110,000 was short-lived as traders affirmed that the upside was not over for BTC.
“The crucial factor is that Bitcoin holds the support above the 20-Week MA” currently at $113,300, said MN Capital founder Michael van de Poppe in an X post on Sunday.
Van de Poppe added that Friday’s drop below this level “provided a massive opportunity” for buyers, and reclaiming it indicated “we are continuing the uptrend.”
Echoing these sentiments, fellow Mikybull crypto said that Bitcoin “is still in bullish territory from a price action structural perspective,” adding:
“As long as $BTC and $ETH are still looking great on the HTF charts, the bullish vibe continues.”
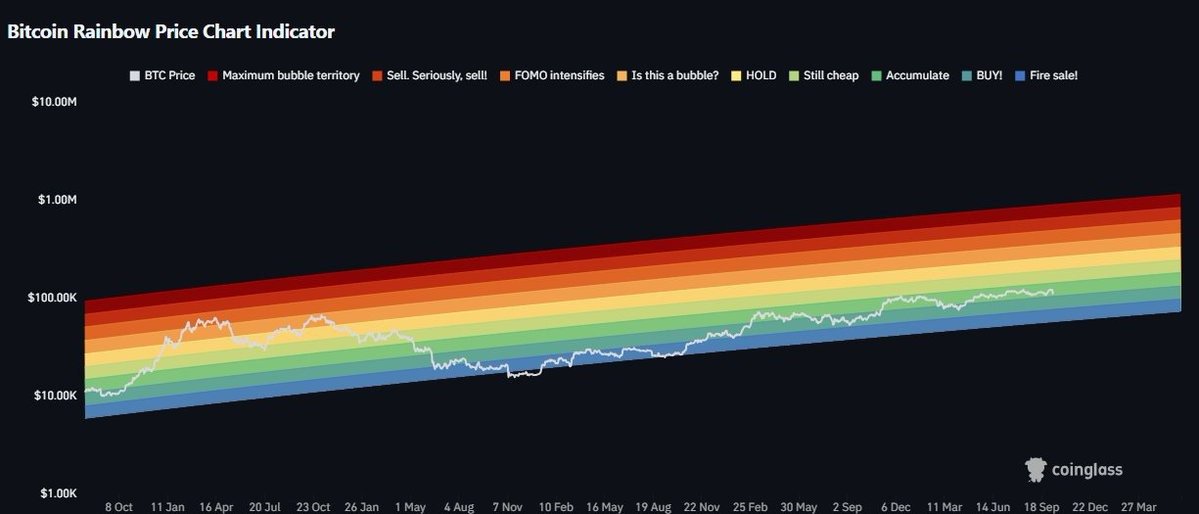
Daan Crypto Trades said that his “base case for this cycle has always been $120K-$150K.”
Looking at Bitcoin’s rainbow price chart indicator, the analyst said that the “light green/yellowish region ($140K-$200K)” would probably be a good point to start scaling out more heavily once the price reaches these levels.
Crypto analyst Jelle said Bitcoin had experienced a “2017-style washout” but still held key levels, adding:
“I don’t really mind the way this looks. The target remains $150,000.”
As Cointelegraph reported, Bitcoin is retesting the “golden cross,” a bullish technical pattern that has historically preceded rallies of 2,200% in 2017 and 1,190% in 2020. A confirmed breakout could see Bitcoin’s price go parabolic in the coming weeks.
This article does not contain investment advice or recommendations. Every investment and trading move involves risk, and readers should conduct their own research when making a decision.
