


Renowned technical analyst John Bollinger has identified patterns in Ether and Solana charts that could suggest a big move ahead, especially if something similar happens with Bitcoin.
John Bollinger has identified “potential ‘W’ bottoms” in Bollinger Bands, a volatility indicator that he invented, on Ether (ETH) and Solana (SOL) charts, but the pattern has yet to form on the Bitcoin (BTC) chart, he said.
“Gonna be time to pay attention soon, I think.”
ETH and SOL appear to be setting up double bottoms while Bitcoin is still forming its base. A ‘W’ bottom in Bollinger Bands is a bullish reversal signal that indicates potential upward price movement.
Ether has fallen to $3,700 twice this month and appears to be recovering, while Solana mirrored the move with a double dip to $175 in October, followed by a minor recovery.

Bitcoin has made a major ‘V’ shaped dip, falling below $104,000 on Friday before recovering over the weekend to trade at the lower band of a range-bound channel that formed in mid-May when it broke into six figures.
Time to pay attention
Analyst ‘Satoshi Flipper’ observed that the last time Bollinger advised paying attention was in July 2024. Bitcoin pumped from below $55,000 to over $100,000 in the six months that followed.
“It is indeed time to pay attention. That’s a real Squeeze and the controlling feature is a two-bar reversal at the lower band,” he said at the time.
Related: Bitcoin indicator’s record squeeze signals ‘significant volatility storm’ ahead
Following months of tight compression, Bitcoin Bollinger Bands have widened this month as volatility increased with the record leverage flush last weekend. Analysts had predicted this “volatility storm” during the market lull in September.
Watch the 50-week SMA
BTC has failed to break above the support-turned-resistance level at $108,000 since its Friday dump.
However, analysts remain confident that we are not in a bear market yet, despite all the fear and panic.
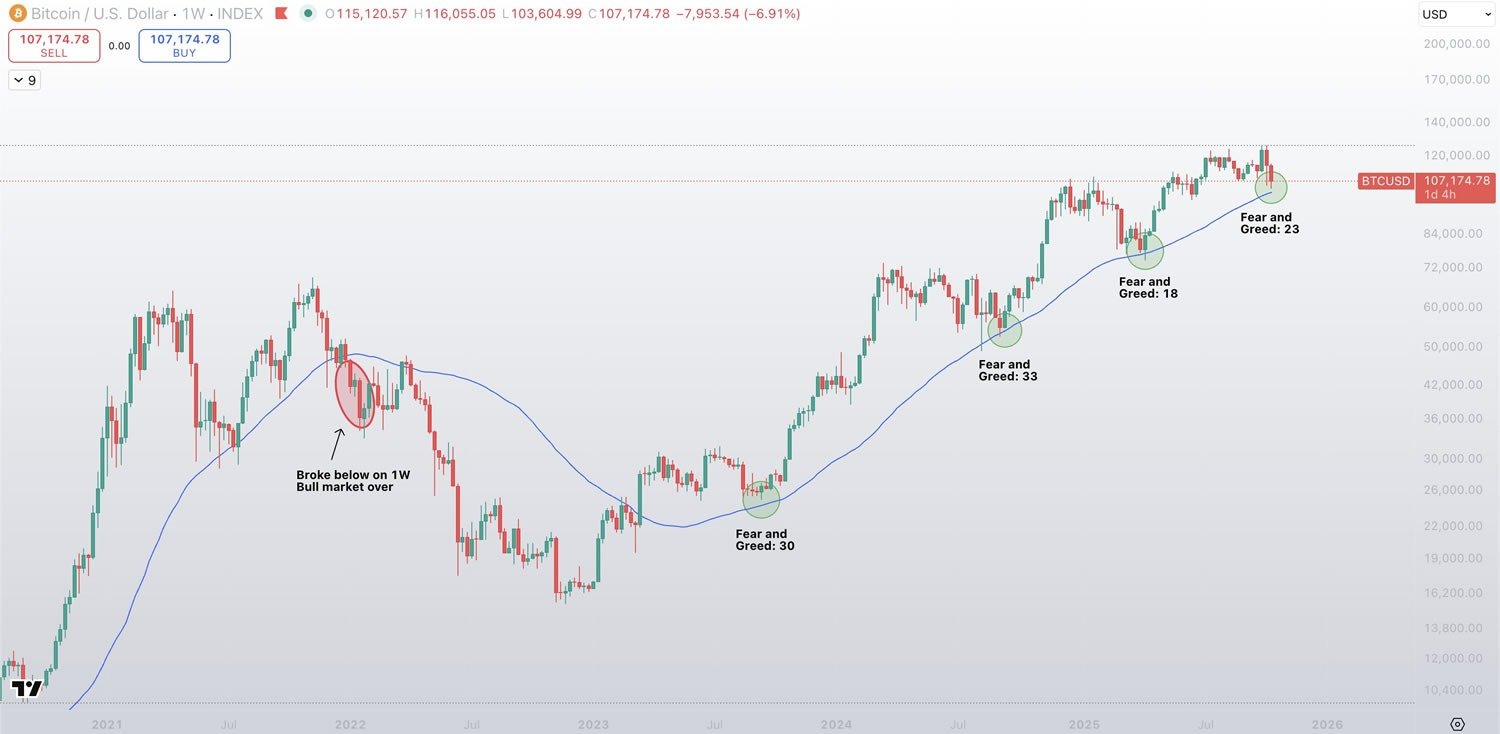
Analyst ‘Sykodelic’ said markets are still in an uptrend, using the 50-week simple moving average, which has been tagged four times since November, as a technical indicator.
“Every single time the price has come down to tag the 1W 50SMA, there has been mass fear in the market, with the majority panic selling and everyone saying it is over. And every time it has rebounded with strength and pushed much higher.”
Magazine: Ether’s price to go ‘nuclear,’ Ripple seeks $1B XRP buy: Hodler’s Digest
