


Key takeaway:
-
Bitcoin’s bullish megaphone pattern suggests $144,000-$260,000 is in play this cycle.
-
Signs of panic from BTC short-term holders hint at a potential local bottom.
Bitcoin (BTC) price action has painted bullish megaphone patterns on multiple time frames, which may propel BTC to new record highs, according to analysts.
BTC price can reach $260,000 this cycle
The bullish megaphone pattern, also known as a broadening wedge, forms when the price creates a series of higher highs and lower lows. As a technical rule, a breakout above the pattern’s upper boundary may trigger a parabolic rise.

Bitcoin’s daily chart shows two megaphone patterns, as shown in the figure below. The first is a smaller one formed since July 11, and the recent rebound from the pattern’s lower trendline at $108,000 suggests the formation is indeed playing out.
Related: Bitcoin can still hit $160K by Christmas with ‘average’ Q4 comeback
The pattern will be confirmed once the price breaks above the upper trend line around $124,900, coinciding with the new all-time highs reached on Aug. 14. The measured target for this pattern is $144,200, or a 27% increase from the current level.
The second is a bigger megaphone pattern that has been forming for the “past 280 days,” as analyst Galaxy pointed out in a Thursday X post.
Bitcoin is trading near the upper trendline of the megaphone, which currently sits around $125,000. Similarly, a break above this level would confirm the pattern, clearing the path for a rally toward $206,800. Such a move would bring the total gains to 82%.
Meanwhile, crypto influencer Faisal Baig highlighted Bitcoin’s breakout from a giant megaphone pattern on the weekly time frame with an even higher measured target: $260,000.
“The next leg up is inevitable.”
Bitcoin has broken out of this bullish megaphone pattern.
The next leg up is inevitable.
IN SHAA ALLAH pic.twitter.com/iEIpKROSvv— Faisal Baig Binance Usdt Signals (@fbmskills) August 20, 2025
As Cointelegraph reported, Bitcoin’s recent pullback to $108,000 is likely to be a shakeout before new all-time highs.
BTC short-term holder metric hits April lows
Bitcoin’s 12% drop from $124,500 all-time highs sent short-term holders (STHs) — investors who have held the asset for less than 155 days — into panic mode as many sold at a loss.
This has had serious implications on the STH market value realized value (MVRV) ratio, which has fallen to the lower boundary of its Bollinger Bands (BB), signaling oversold conditions.
“On the pullback to $109K, $BTC tapped the ‘oversold’ zone on the short-term holder MVRV Bollinger Band,” said analyst Frank Fetter in an X post on Thursday.
An accompanying chart shows a similar scenario in April when Bitcoin bottomed out at $74,000. The BB oscillator dropped to oversold conditions before Bitcoin started recovering and is up 51% since.
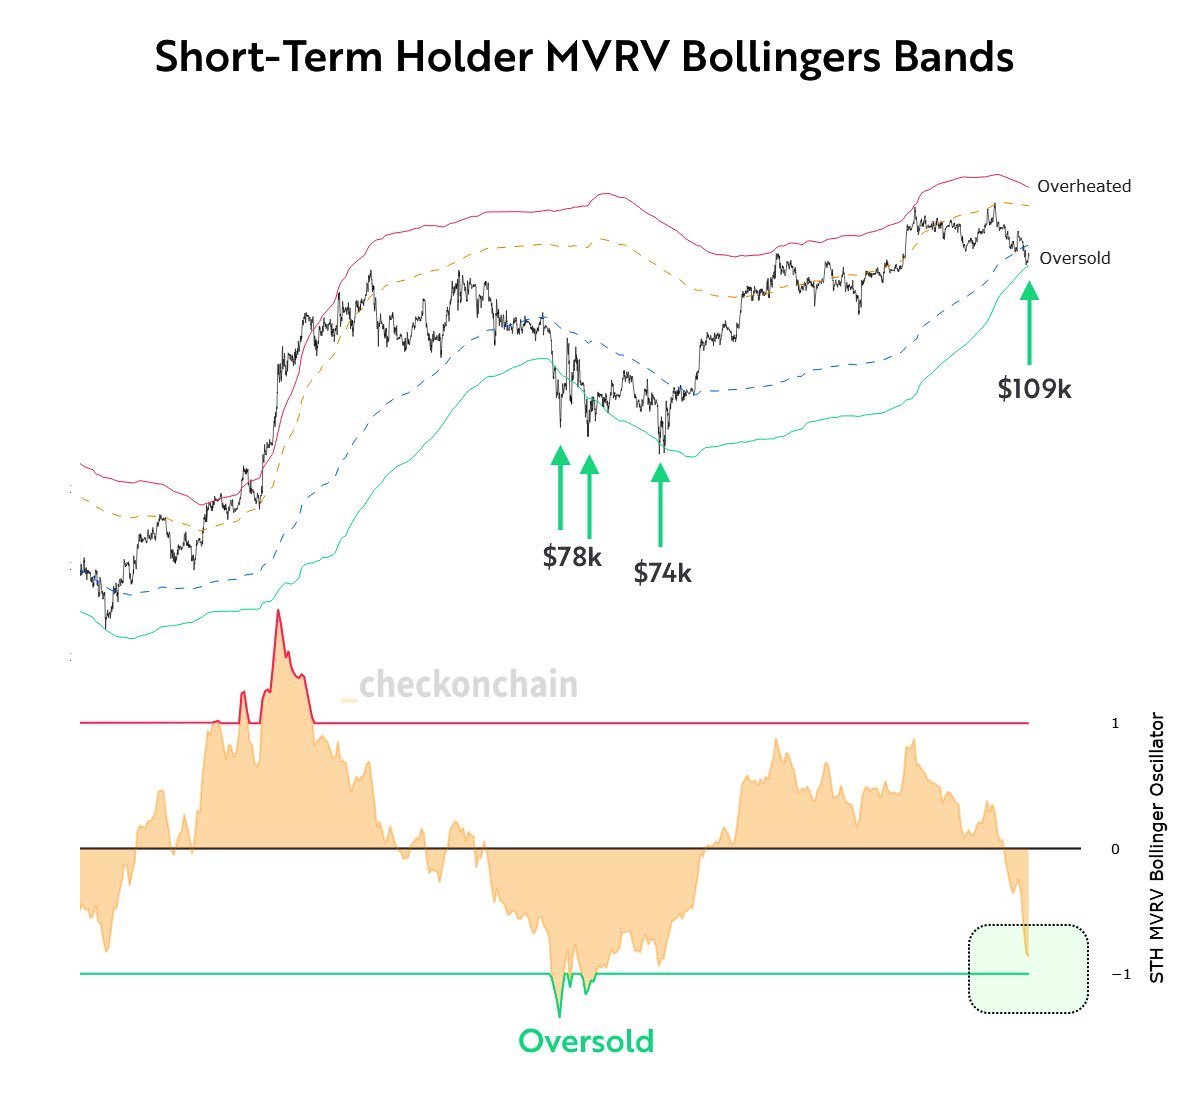
With the latest drawdown, the oversold STH MVRV suggested that the BTC price was due for an upward relief bounce, possibly staging a similar recovery to April and August.
As Cointelegraph reported, retail and institutional accumulation have now been at their highest since April’s dip below $75,000, which could be another sign that $108,000 was a local bottom.
This article does not contain investment advice or recommendations. Every investment and trading move involves risk, and readers should conduct their own research when making a decision.
