


Key takeaways:
-
Another Bitcoin price pullback to $117,000 is possible before the uptrend resumes.
-
A classic chart pattern puts BTC price on course for $145,000 in the next few months.
Bitcoin (BTC) reached a six-week high of $119,500 on Thursday, following a 10% rise from its local low of $108,650 seven days prior. BTC has now reclaimed a key support level as prices continued to consolidate below its $124,500 all-time high.
Can Bitcoin see new all-time highs in the next few days?

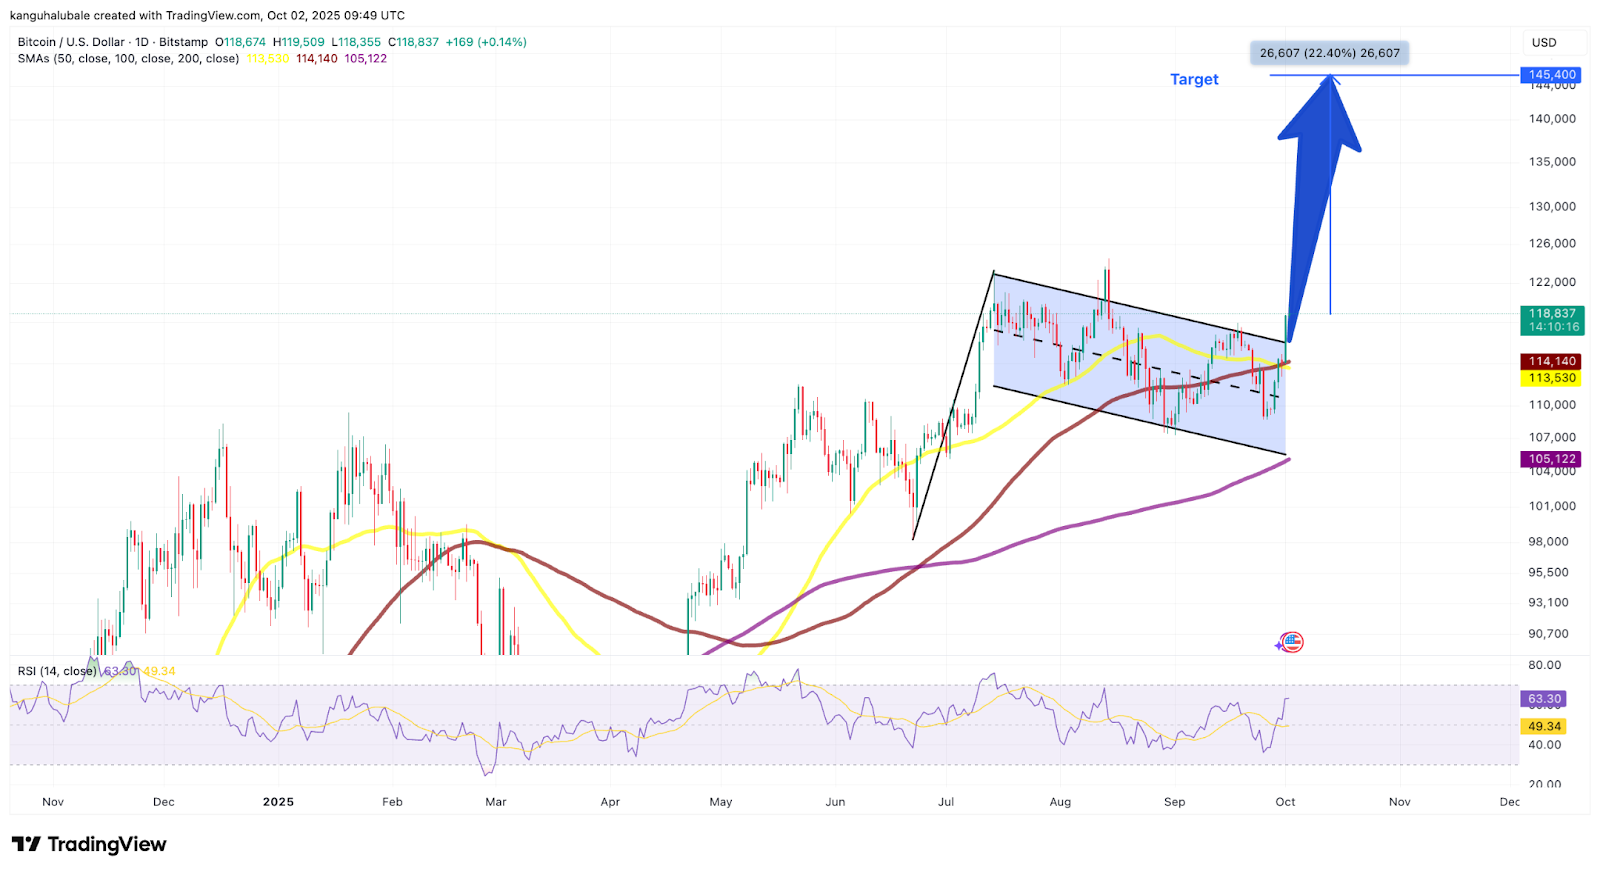
Bitcoin “bull flag” breakout hints at $145,000
After rallying to its current all-time high of $124,500 on Aug. 14, BTC price pulled back to areas below $110,000, forming a bull flag on the daily chart.
A bull flag is a bullish continuation pattern that occurs after a significant rise, followed by a consolidation period at the higher price end of the range.
Related: Bitcoin rallies as US government shutdown begins: Will BTC gains continue?
The latest data from Cointelegraph Markets Pro and TradingView shows that BTC has broken out of the bull flag, positioning it for significant gains ahead.
Bitcoin’s “bullish flag upside breakout is confirmed,” said analyst Captain Faibik in his latest analysis on X, pointing out that the mid-term target is at around $140,000.
Bitcoin is “closing strong with a clean breakout of this bull flag,” echoed pseudonymous analyst Gladiator in a Thursday X post, adding:
“This could get explosive and move fast.”
A confirmed breakout from the pennant could open the door for the next leg up, toward $145,400, representing a 22% increase from its current price level.
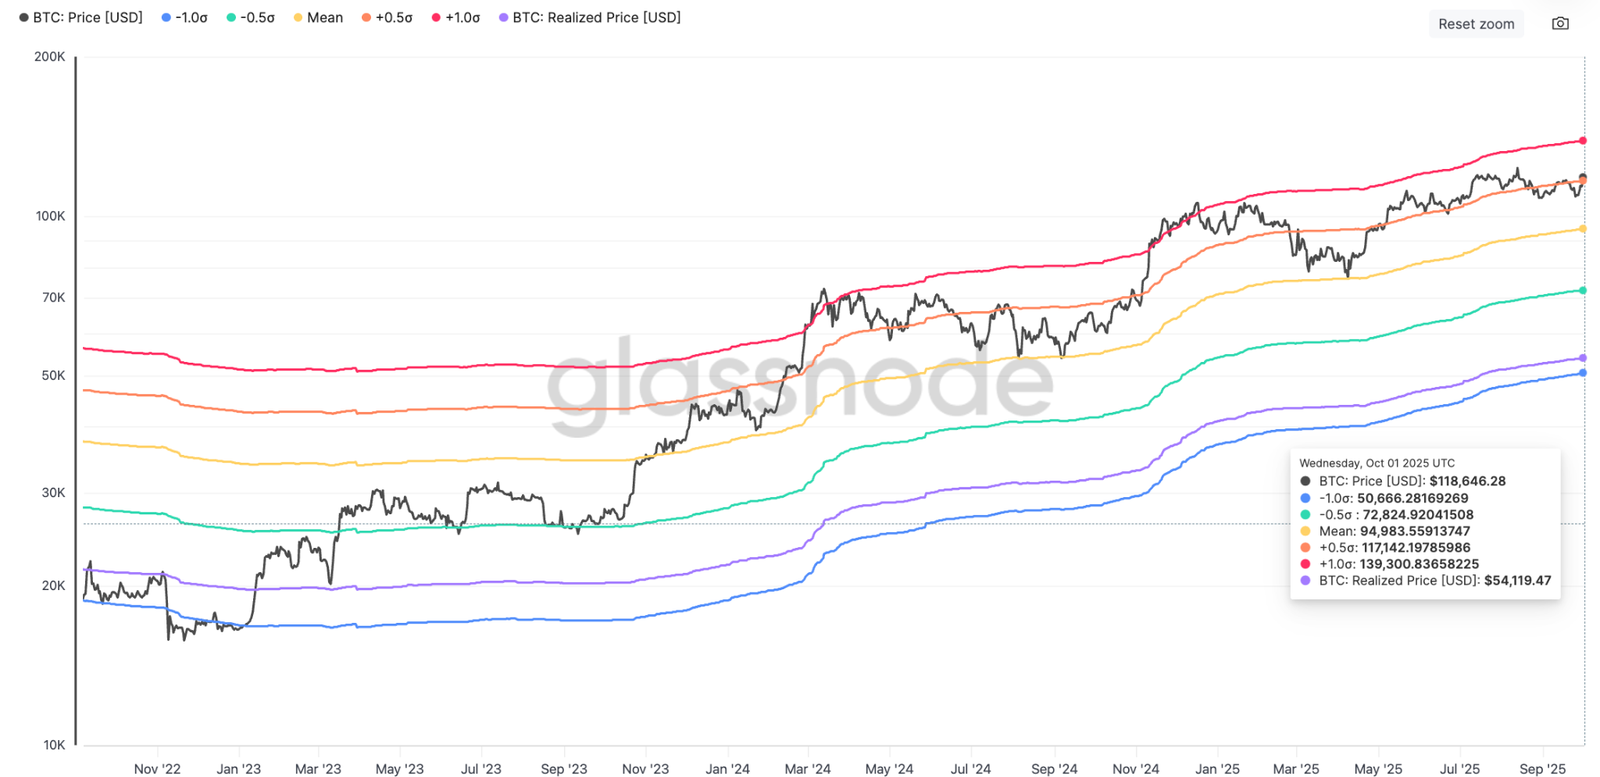
Bitcoin’s MVRV extreme deviation pricing bands suggest that after BTC price broke past $117,000, it could expand further before the unrealized profit held by investors reaches an extreme level, or the uppermost MVRV band at $139,300, as shown in the chart below.
Bitcoin could drop to test support first
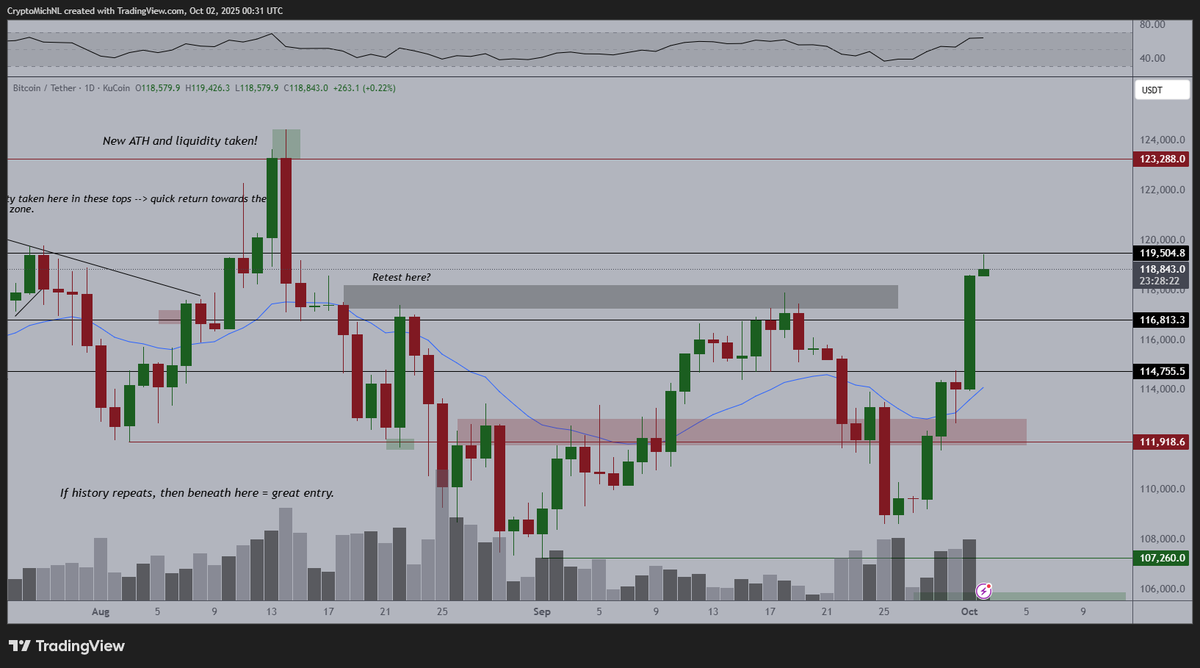
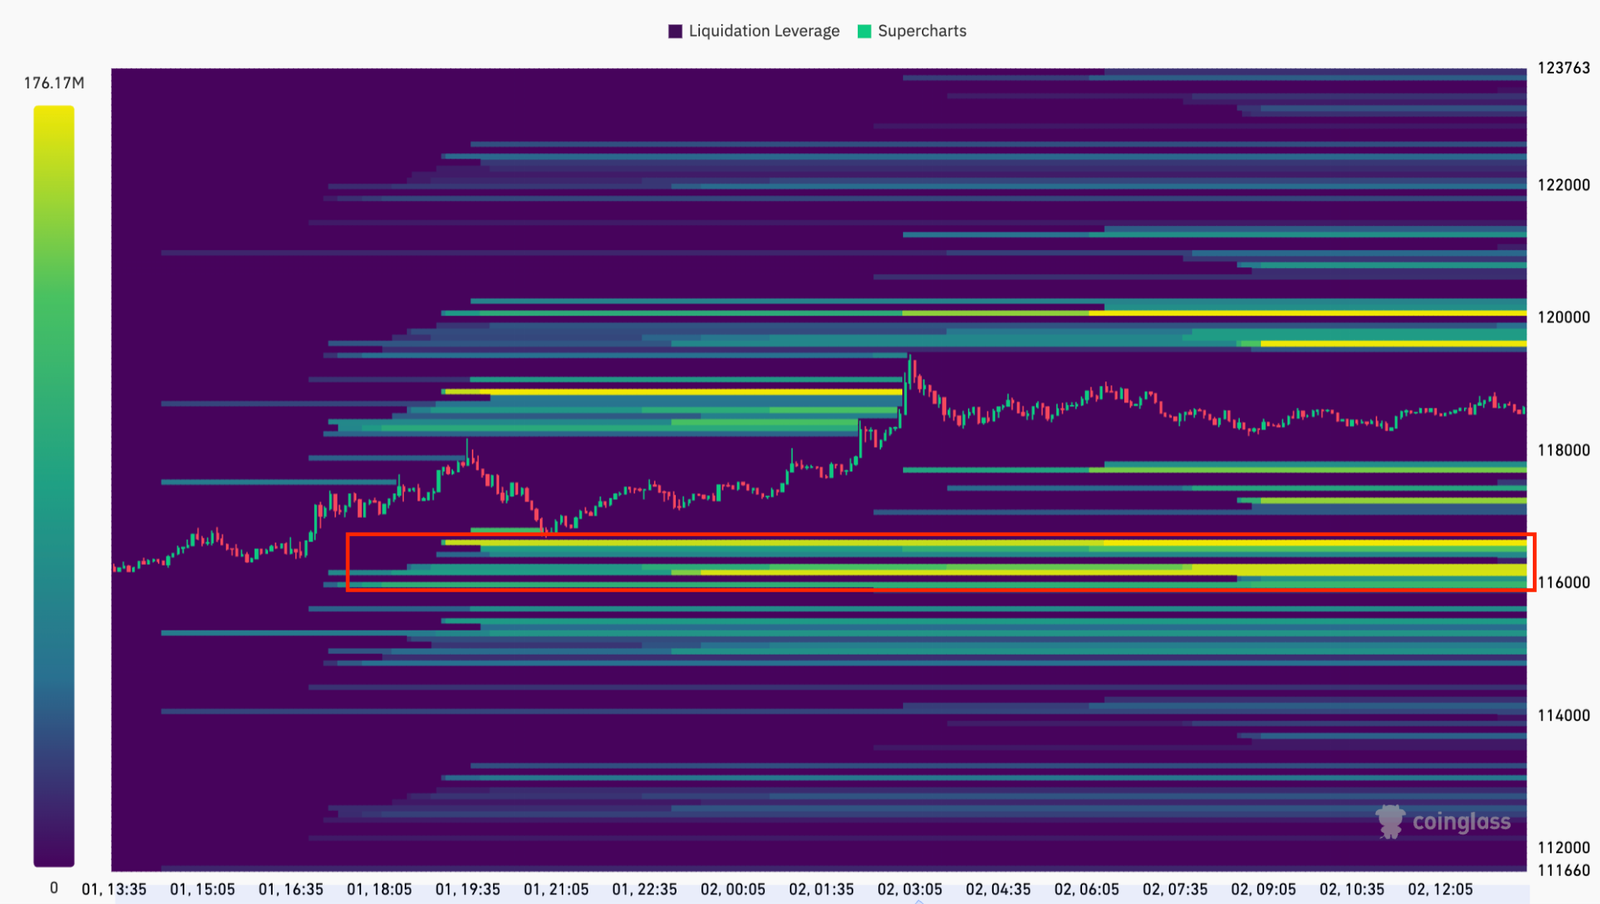
With the bulk of Bitcoin’s apparent sell-side liquidity absorbed during the move to $119,500, some analysts warn that a brief flush down to test $117,000 as support could be the next move for BTC price.
Bitcoin “has taken almost all the liquidity above the recent highs, so I would expect some stalling here,” said MN Capital founder and trader Michael van de Poppe in an X post on Thursday.
An accompanying chart suggested that Bitcoin could drop to retest the support at $117,000 before resuming its recovery.
The BTC liquidity map shows bid clusters stacked between $116,000 and $117,800.
Fellow analyst Ted Pillows said that Bitcoin must hold the $117,000 support level to continue the uptrend, or risk a drop toward $113,500.
He added:
“The only thing between BTC and a new ATH is the $120,000 resistance level.”
As Cointelegraph reported, a decisive break above $120,000 could lead to a breakout toward new all-time highs above $150,000, due to seasonality and institutional demand.
This article does not contain investment advice or recommendations. Every investment and trading move involves risk, and readers should conduct their own research when making a decision.
