


Key points:
-
Bitcoin chops around $114,000 as a whale expects more BTC price losses next.
-
Price pressures short-term holders, who have their cost basis just below the $114,000 mark.
-
Key moving averages are in view as support bases.
Bitcoin (BTC) struggled to hold its rebound at Monday’s Wall Street open as a controversial whale added to their BTC price downside bet.

Bitcoin whale doubles down on BTC price dip
Data from Cointelegraph Markets Pro and TradingView showed BTC/USD retreating from daily highs of $116,000.
The pair quickly closed an upside “gap” in CME Group’s Bitcoin futures market, and then dipped under the daily open.
$BTC CME Gap has now been closed ✅ https://t.co/Cd6fq3Na1A pic.twitter.com/OWy2aa1bb6
— Daan Crypto Trades (@DaanCrypto) October 13, 2025
Markets were unmoved by words from the US government over a potential US-China trade move that could avert a major tariff escalation.
Treasury Secretary Scott Bessent announced “working level” talks with China later in the week.
“We believe this is a tactical escalation (by Beijing) to shape pre-summit bargaining, not a strategic decoupling,” Morgan Stanley analysts wrote in a note on the day, quoted by sources including Reuters.
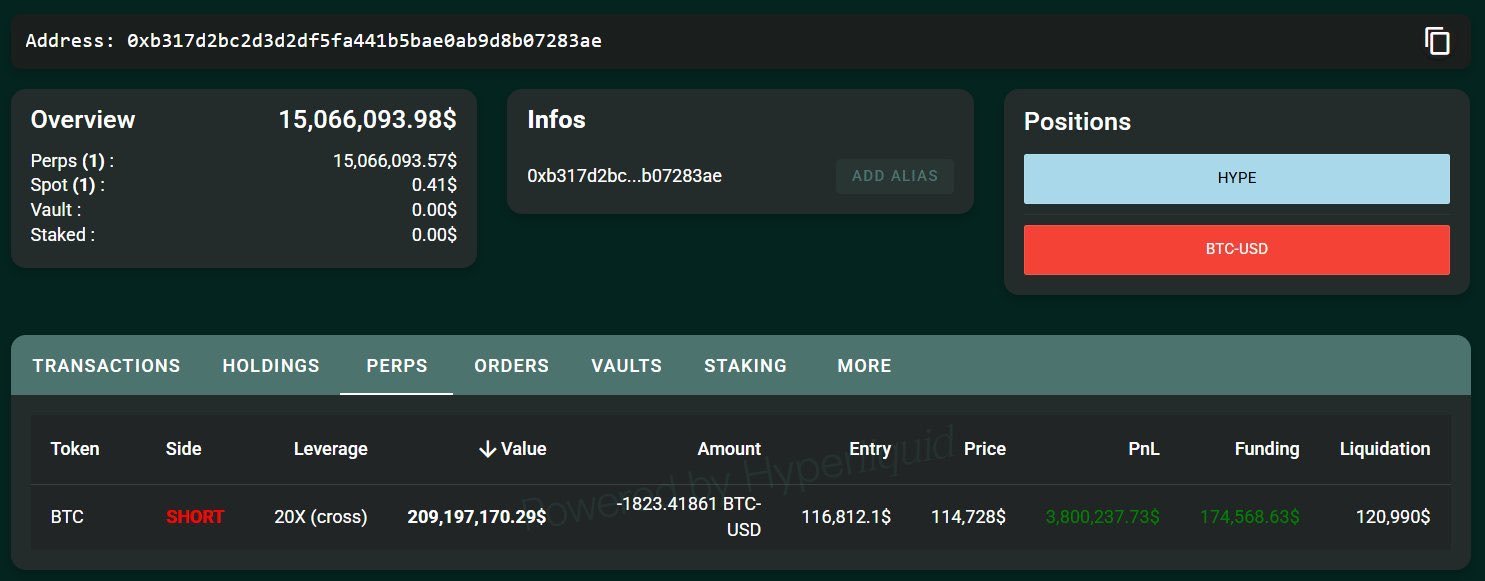
As traders waited for cues, attention focused on an unknown Bitcoin whale who had capitalized on Friday’s $20 billion liquidation event by shorting just before the China news hit.
On Monday, the entity added to its short position, which at the time of writing was worth 3,500 BTC with a liquidation price of around $120,000.
“As I said yesterday, he maybe wants to lose money or get liquidated so people won’t think he had insider information,” crypto analyst and entrepreneur Ted Pillows reacted in a post on X.
Commentator Max Keiser suggested that foul play was involved, claiming that “banks are lending (ie printing) billions to fund naked Bitcoin-shorts.”
“It won’t work,” he added.
Bitcoin speculators flip between profit and loss
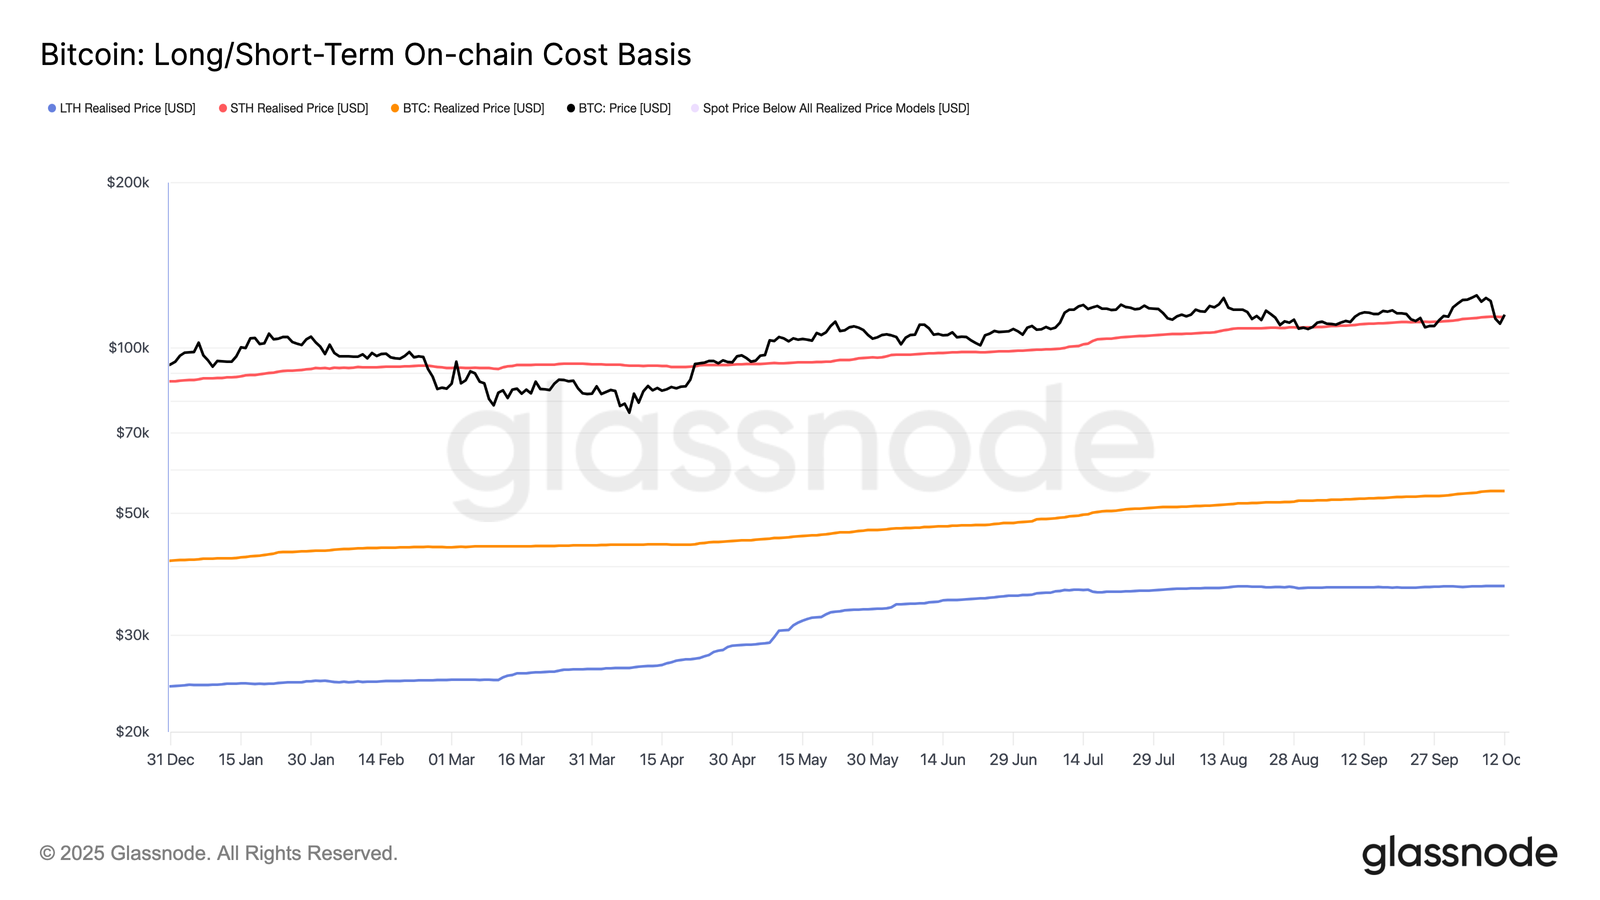
BTC price action thus circled a key support line, represented by the aggregate cost basis of short-term holders (STHs).
Related: $120K or end of bull market? 5 things to know in Bitcoin this week
As Cointelegraph reported, STH wallets, tied to entities hodling for up to six months, function as a safety net during bull market drawdowns.
Data from onchain analytics platform Glassnode puts the STH cost basis at $113,861 as of Sunday.
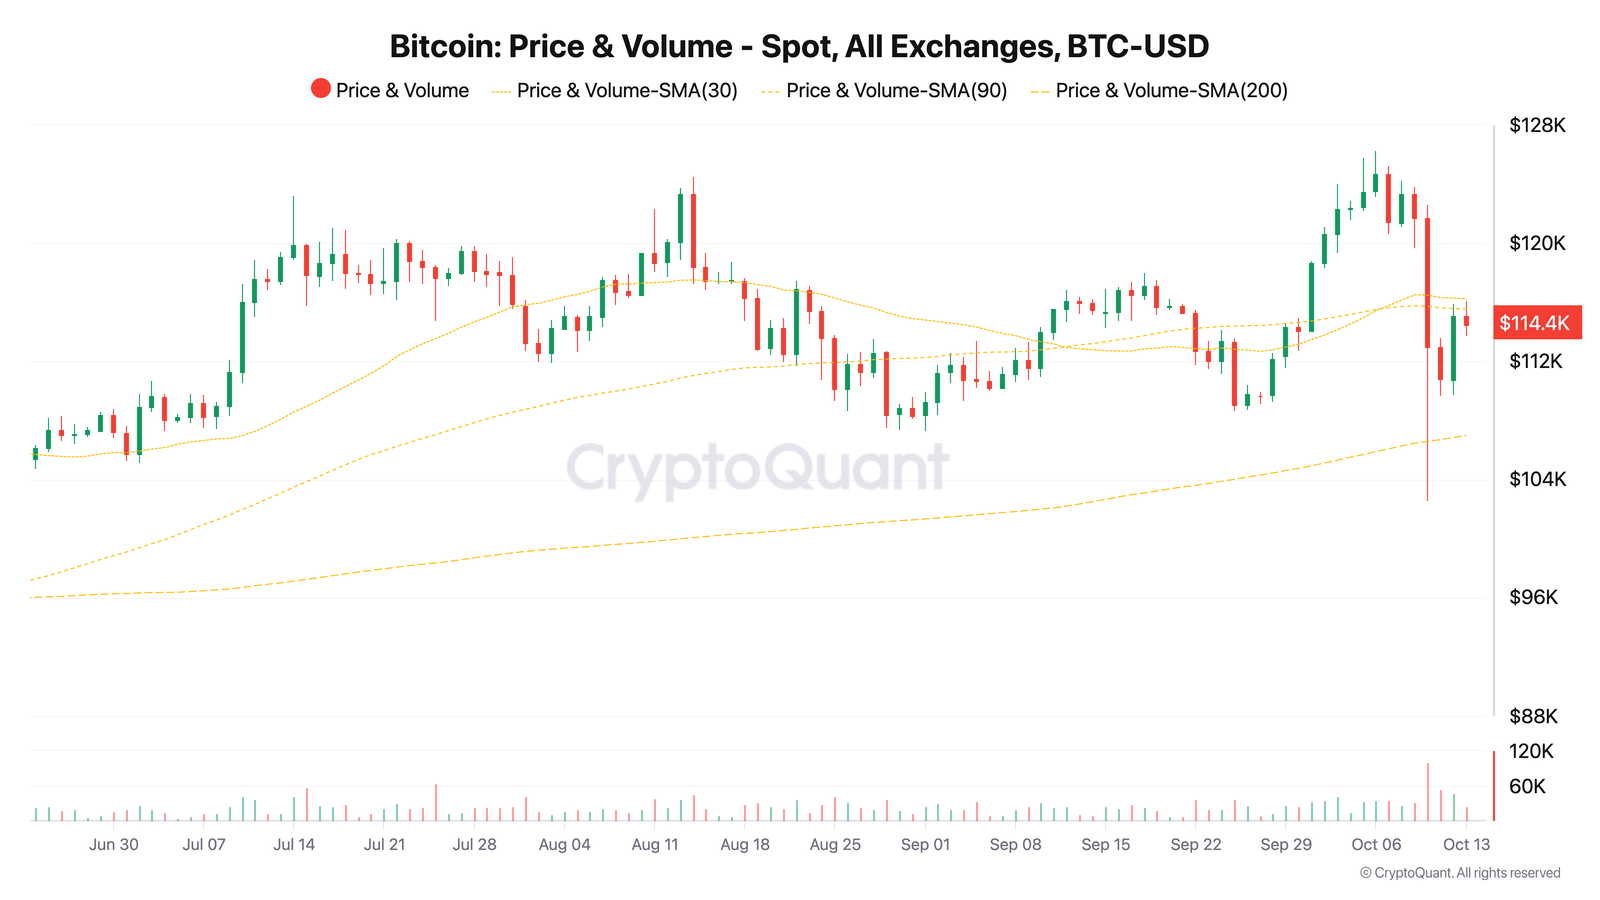
Continuing, onchain analytics platform CryptoQuant flagged three trend lines as important to watch next: the 30-day, 90-day and 200-day simple moving averages (SMAs).
In one of its “Quicktake” blog posts on the day, contributor Arab Chain wrote:
“This structure suggests that the long-term structural uptrend remains intact (as the price is still above the 200-DMA), but short- to medium-term tactical momentum has weakened, with the price now below the 30- and 90-DMA, which have converged into a dynamic resistance zone.”
This article does not contain investment advice or recommendations. Every investment and trading move involves risk, and readers should conduct their own research when making a decision.
