


Key takeaways:
-
Bitcoin needs a weekly close above $114,000 to avoid a deeper correction and reaffirm bullish strength.
-
Failure to hold $112,000 and a bear flag breakdown could trigger drop to $103,700.
Bitcoin (BTC) may avoid an “ugly” correction to lower levels if BTC/USD ends the week above $114,000, according to traders and analysts.
Why Bitcoin price must reclaim $114,000
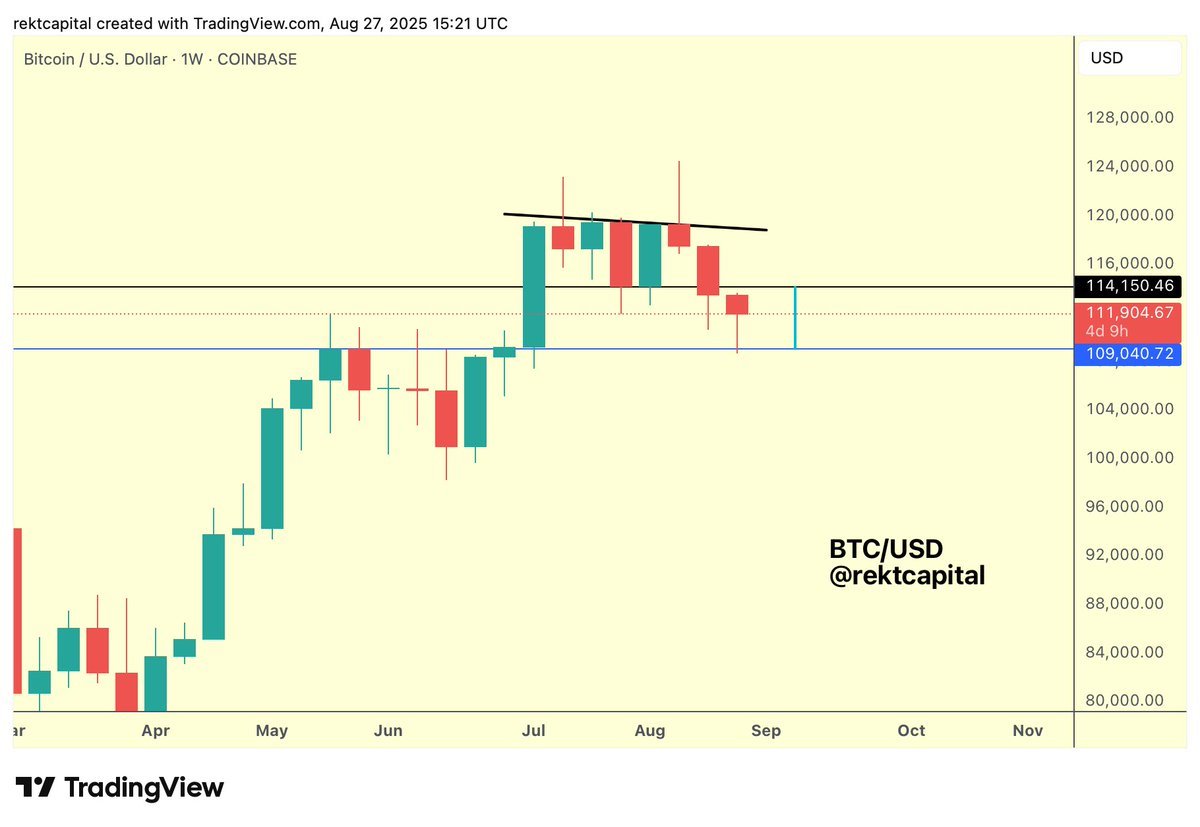
Bitcoin price is heading for its third consecutive week of losses, 11% below its Aug. 14 all-time high of $124,500, per data from Cointelegraph Markets Pro and TradingView.

Bitcoin dropped below the crucial level of $114,000, a level that has supported the price over the previous six weeks, as shown in the chart below.
Related: Bitcoin megaphone pattern targets $260K as BTC price screams ‘oversold’
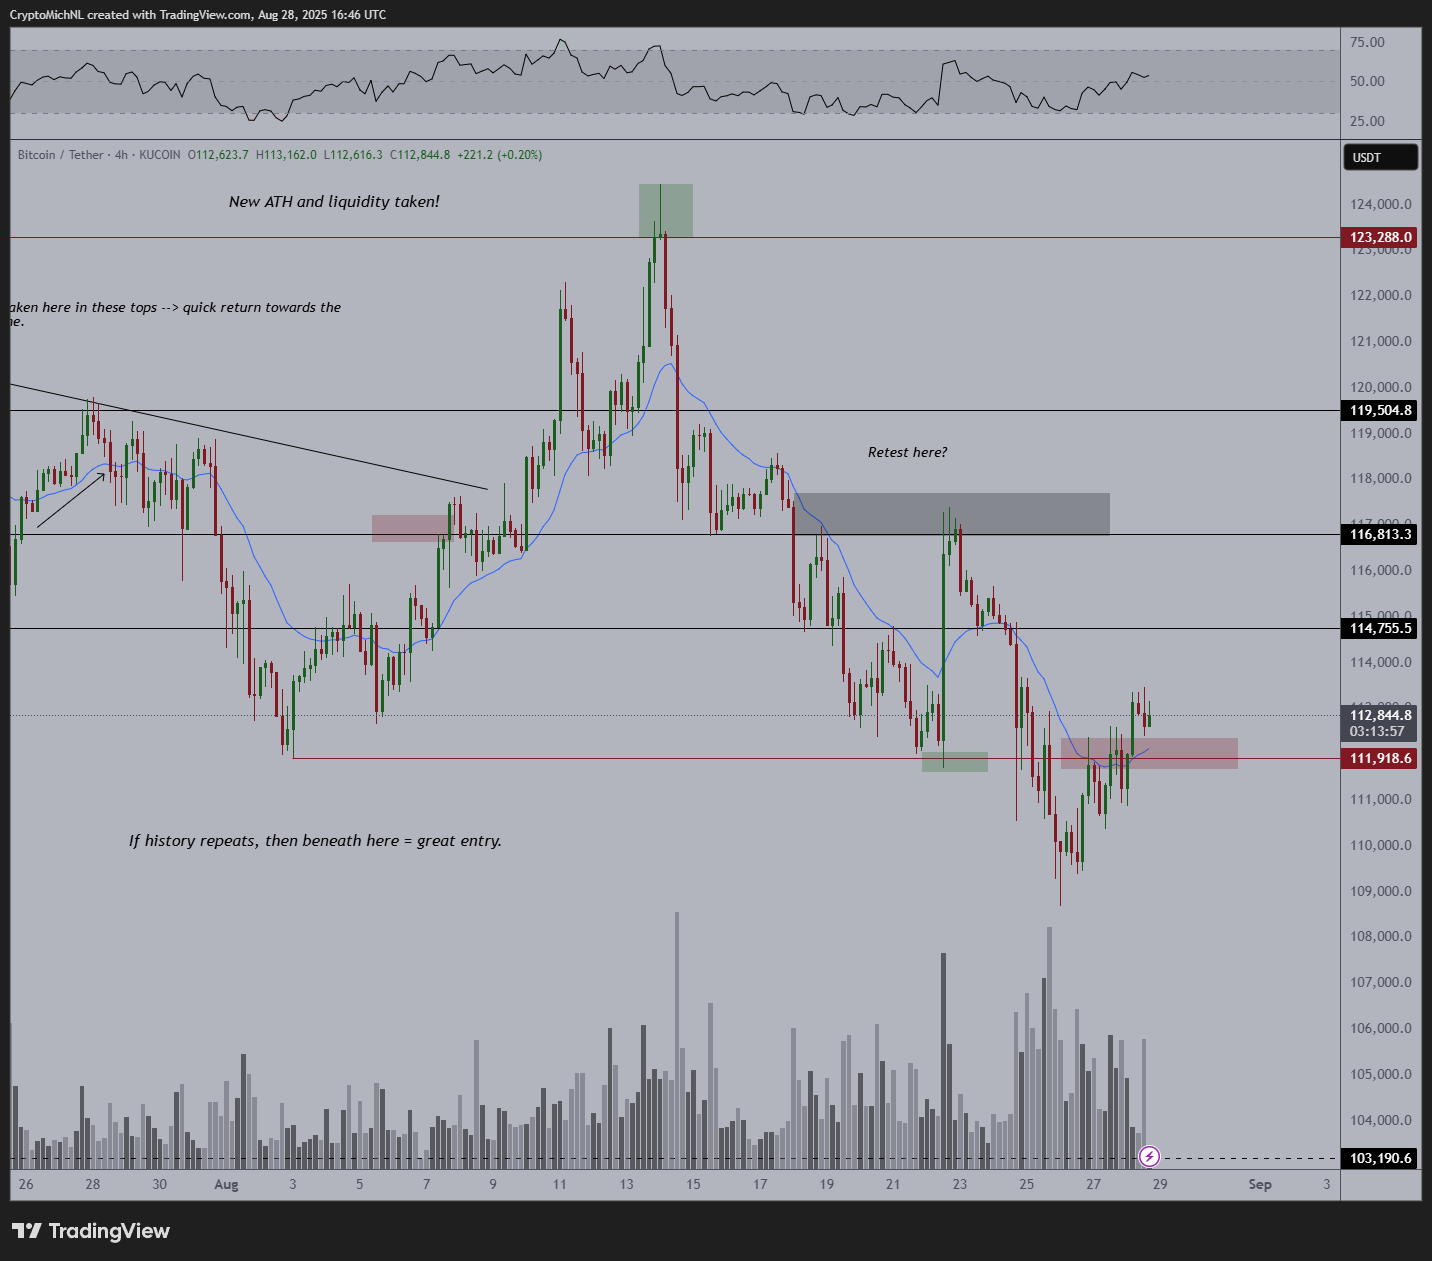
BTC price must flip this level into support to confirm the strength of the uptrend, according to trader and YouTuber Sam Price.
“Bitcoin bulls are defending $109K support nicely,” Price said in an X post on Thursday, adding:
“A weekly close above $114K would be big.”
The long wick below $109,000 signalled “solid buy pressure,“ suggesting that bulls are aggressively defending this support level.
Analyst Rekt Capital said that it was important for Bitcoin to reclaim $114,000 as support to avoid a prolonged correction period.
“Turning $114K into new resistance would prolong the pullback period,” the analyst said in a Thursday X post, adding:
“This has been a cycle of downside deviation, so all it comes down to is Bitcoin Weekly Closing above $114K for bullish bias.”
Bitcoin bears want to pull price down to $103,000
As Cointelegraph reported, Bitcoin’s price outlook hinged on holding above $112,000.
Similar sentiments were shared by MN Capital founder Michael van de Poppe, who spotted Bitcoin trading at $112,800 on Thursday and said that the support at $112,000 was “crucial” for BTC price.
“If Bitcoin can’t hold above $112K, we’ll probably face a very ugly correction across the board.”
Bitcoin had dipped below this support as of Friday, validating a bear flag on the four-hour chart, as shown.
A bear flag suggests a continuation of the bearish momentum, with sellers taking control.
Note that the price was rejected from the upper boundary of the flag, which is around $114,000, and has dropped below the lower boundary, which coincides with $112,000.
The measured move target from the pattern suggests a potential decline toward $103,700, representing a 6% drop from the current level.
The relative strength index remains below the mid-line, confirming the bearish momentum.
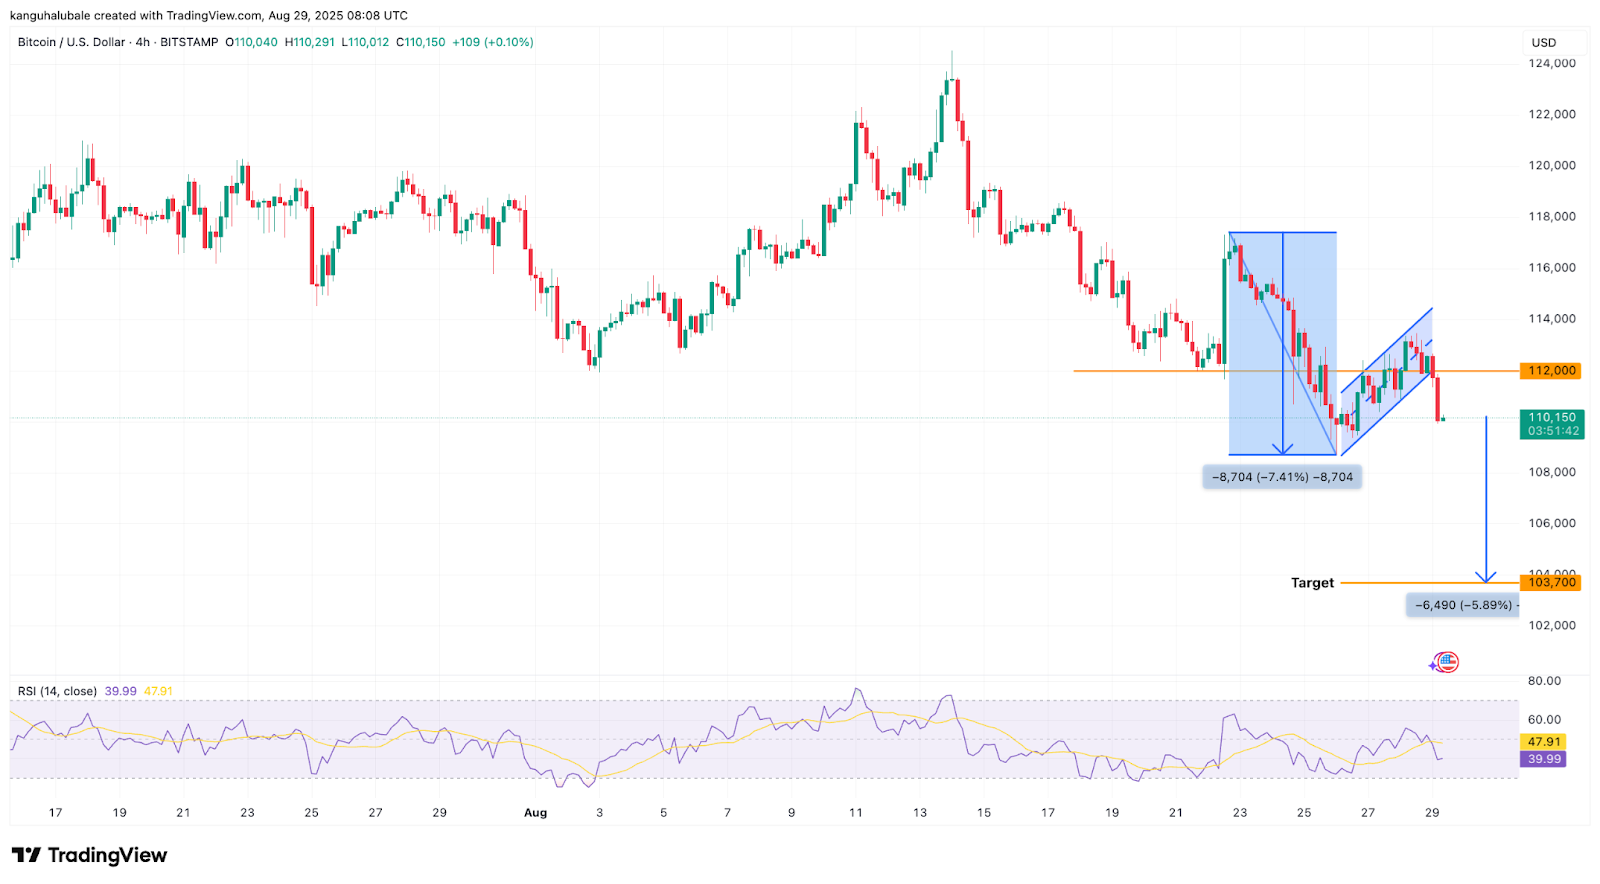
Liquidation data shows bid clusters all the way down to $104,000, suggesting that BTC price is likely to sink deeper to grab liquidity around this level.
This article does not contain investment advice or recommendations. Every investment and trading move involves risk, and readers should conduct their own research when making a decision.
