


Key points:
-
Bitcoin ignores US jobs data and falls over 2% on the day.
-
A high-volume area now comes into play as support, even as analysis sees a BTC price comeback next.
-
Gold continues to make headlines by beating crypto and US stocks this bull market.
Bitcoin (BTC) fell back under $109,500 after Thursday’s Wall Street open as US jobs data failed to boost crypto.

Bitcoin fails to crack resistance in fresh dip
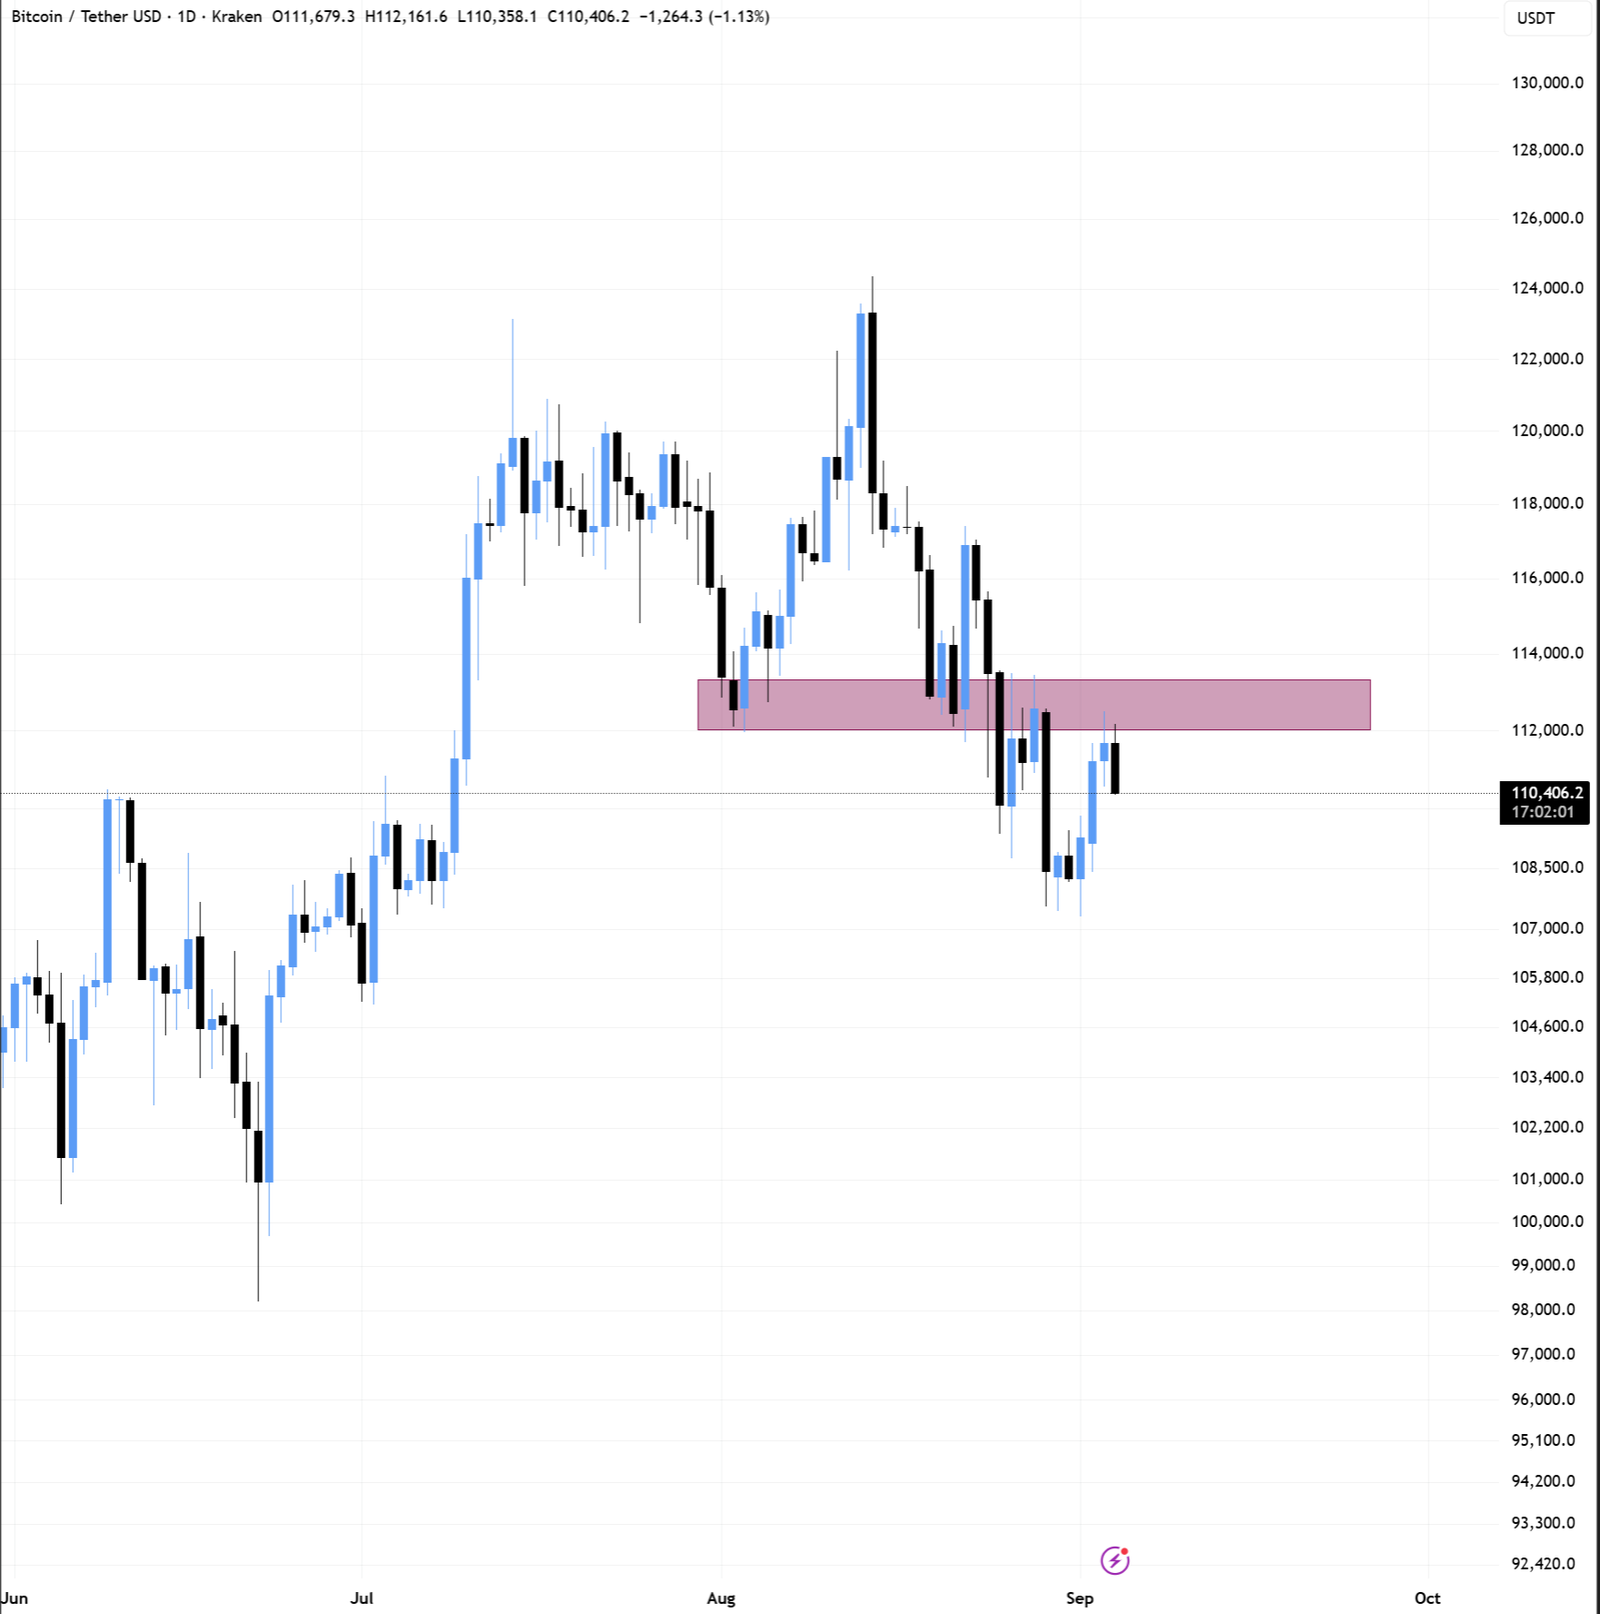
Data from Cointelegraph Markets Pro and TradingView showed BTC/USD losses passing 2% on the day.
Bulls failed to flip the area around $112,000 to support, and despite US unemployment numbers showing a weakening labor market, downside pressure remained.
“$BTC got rejected from its major resistance level,” popular trader BitBull confirmed in a post on X.
“Until the $114K level is reclaimed on the daily timeframe, every BTC move will just be a bull trap. Also, the longer it’ll take BTC to reclaim $114K level, higher the chances of a big correction before reversal.”
As Cointelegraph reported, many market participants see a retest of $100,000 support coming in the short term.
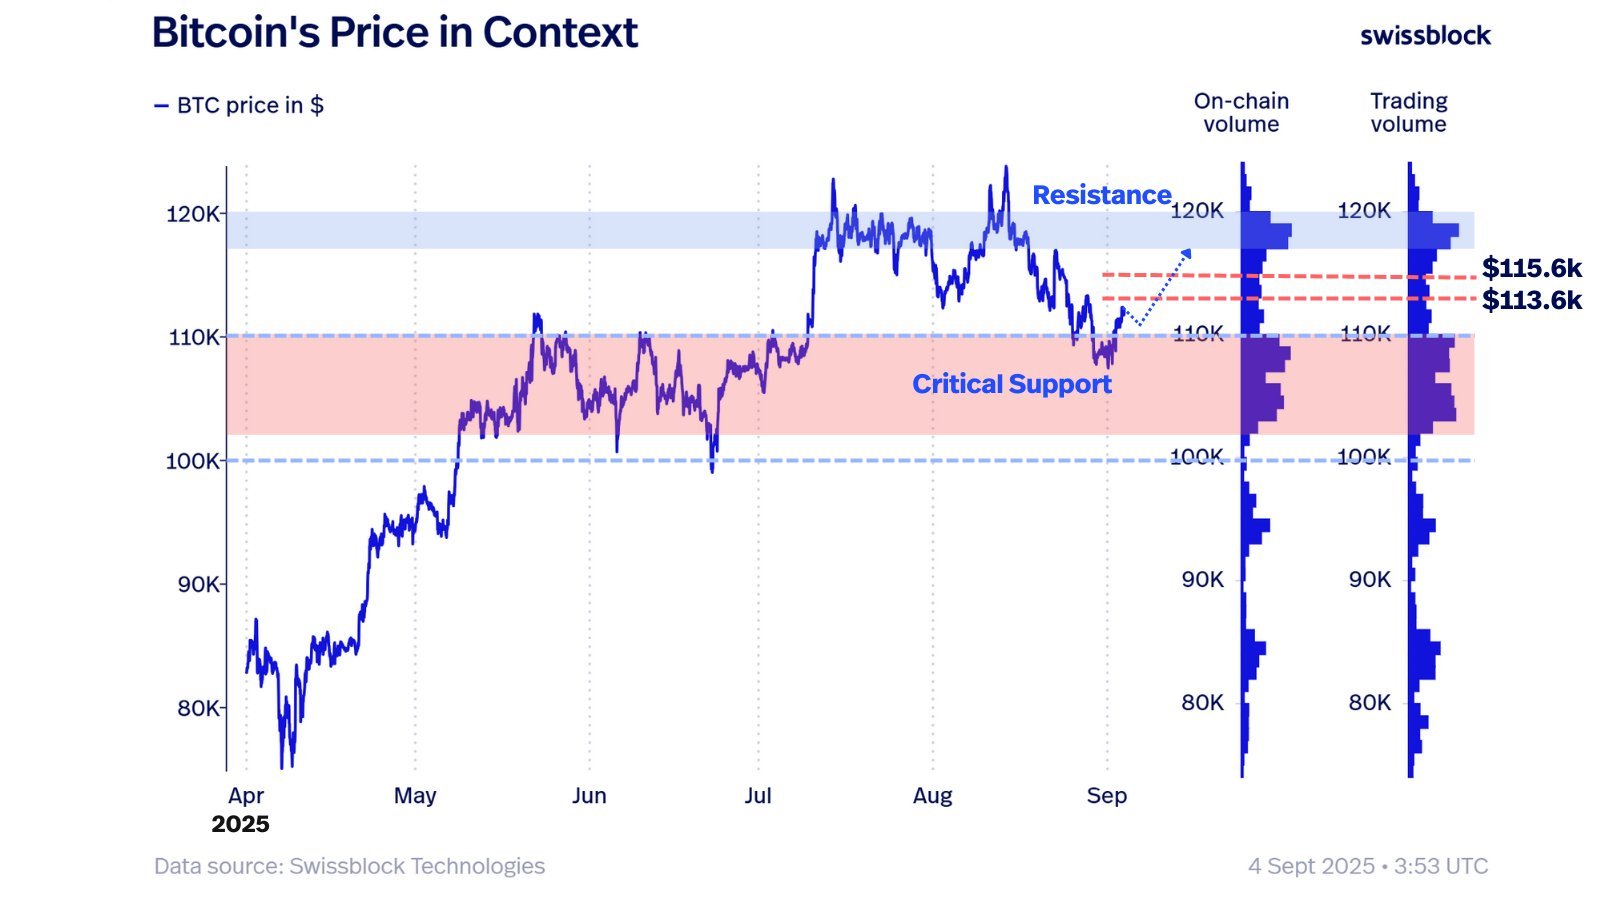
On the more optimistic side, crypto market insight company Swissblock flagged “critical support” now lying at $110,000 in the form of an area of high trading volume. Resistance to the upside was thinning, it told X followers on the day.
“Bitcoin is breaking out from the critical zone: a straight slide to $100K was never the base case. The wall resisted, until now,” a post stated.
“Above, there is the $113.6K–$115.6K gate. After a pullback, price needs fresh momentum to clear it, then contend with heavy resistance into $118K.”
Gold steals the show from crypto, stocks
The macro picture, meanwhile, favored stocks as weaker labor market signals cemented the odds of the Federal Reserve cutting interest rates on Sept. 17.
Related: Bitcoin bear market due in October with $50K bottom target: Analysis
Amid rising inflation, however, trading firm Mosaic Asset was cautious. This month’s cut, it warned, could be the Fed’s only one.
“While odds for a rate cut appear locked in (pending no huge upside surprise in August payrolls), the Fed could still be facing a “one and done” scenario on reducing rates,” it wrote in its latest “Mosaic Chart Alerts” update on the day.
“That’s because of evidence that inflationary pressures continue building with inflation-sensitive areas of the capital markets moving higher.”
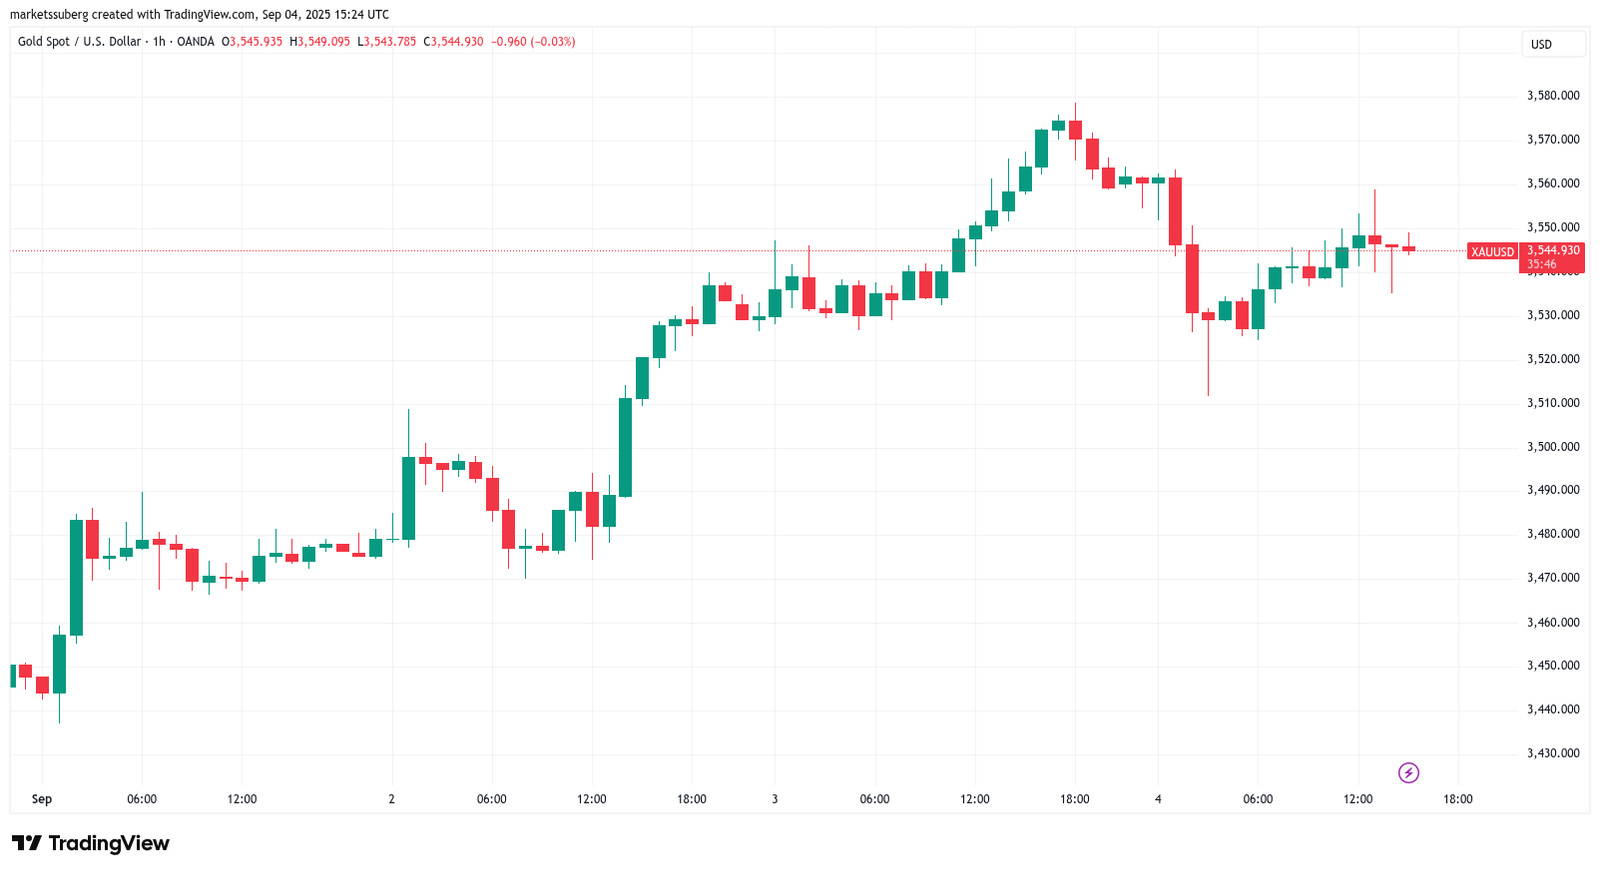
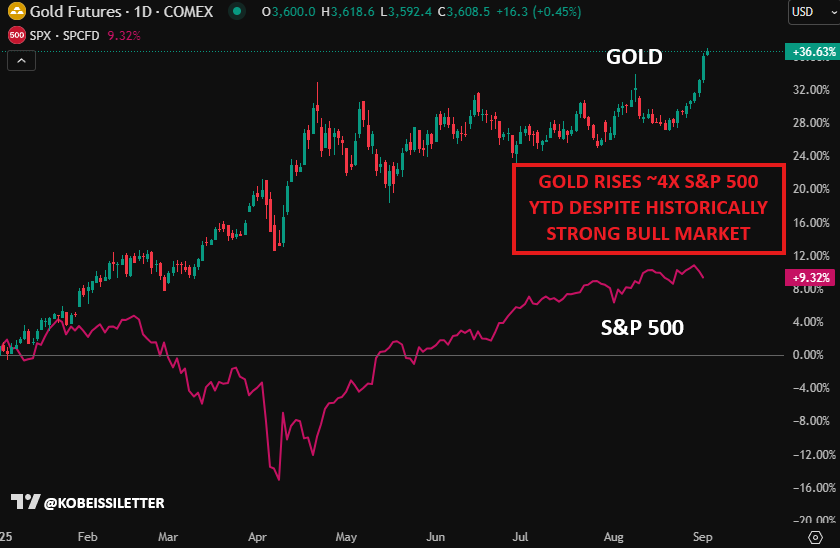
Mosaic Asset and trading resource The Kobeissi Letter referenced the ongoing gold breakout, which has beaten stocks and left crypto flagging in its wake.
“It’s a combination of market pricing in higher long-term inflation and more deficit spending,” Kobeissi wrote in an X thread on Wednesday.
“And, adding fuel to the fire, deficit spending is flooding the US Treasury market with supply. Gold has become the GLOBAL safe haven asset.”
This article does not contain investment advice or recommendations. Every investment and trading move involves risk, and readers should conduct their own research when making a decision.
