


Key points:
-
Bitcoin stabilizes into the weekend, but market sentiment is anything but relaxed about the outlook.
-
BTC price forecasts increasingly feature sub-$100,000 levels.
-
RSI signals still point to a rebound — something more likely if stocks head higher next week.
Bitcoin (BTC) clung to $107,000 on Saturday as traders braced for fresh lows next.

Bitcoin traders still doubt strength of $100,000
Data from Cointelegraph Markets Pro and TradingView showed cooling BTC price volatility into the weekend.
This gave bulls some much-needed relief after a week of nasty surprises left BTC/USD down another 7%.
Now at its lowest levels in months, the pair was tipped for even lower levels in the short term amid a lack of buyer demand and major macroeconomic change.
“It all lines up nicely across the board for another wave down,” trader Crypto Tony wrote in an X post on the day.
“Bitcoin i see us dropping to $95,000, possibly testing the $91,000 region before we find a bottom.”
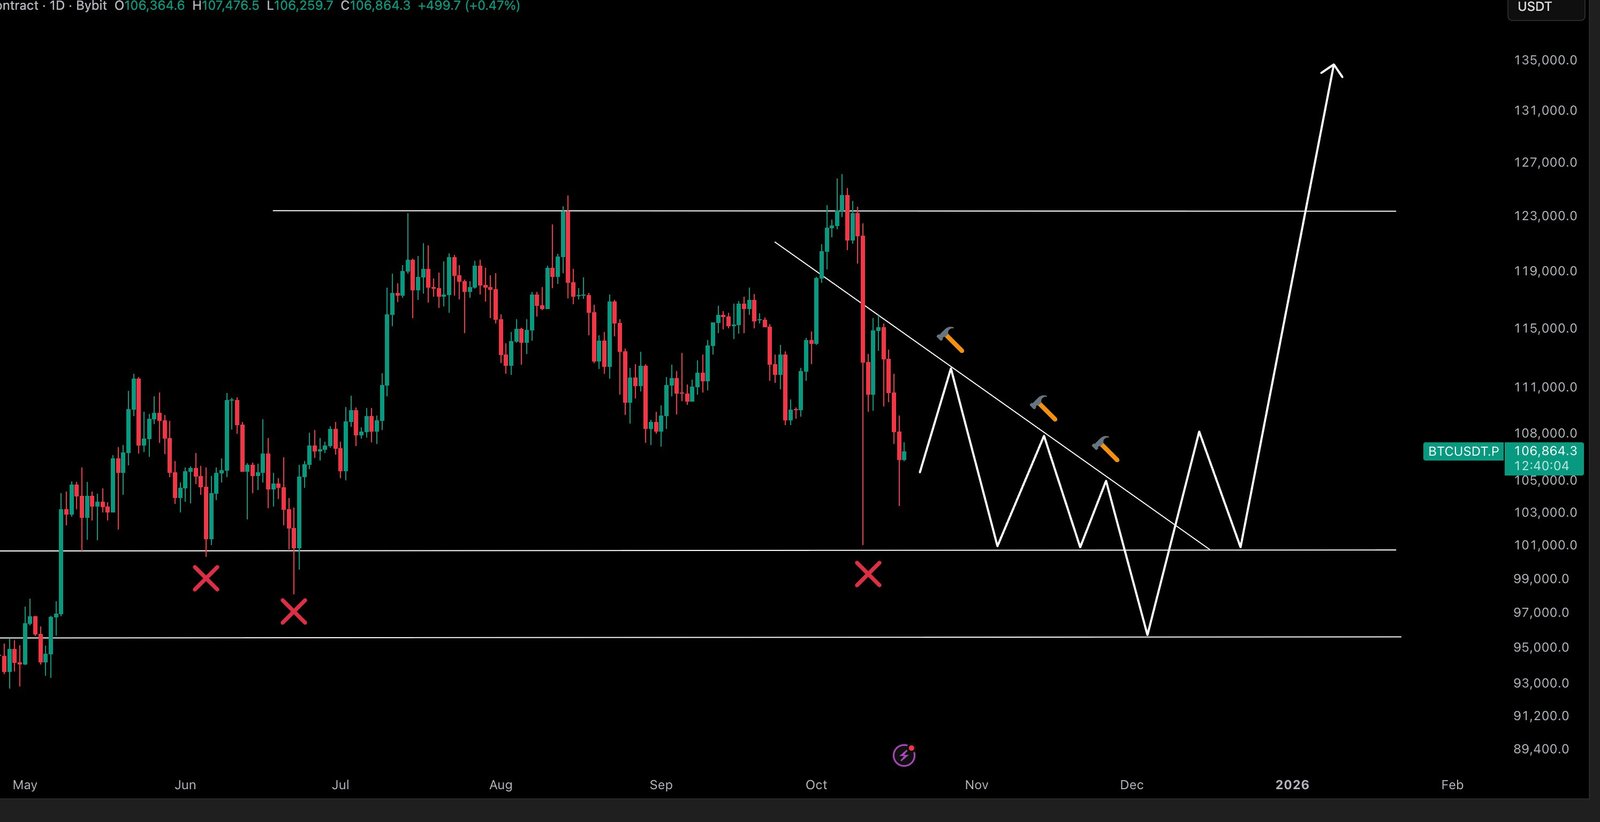
Crypto Tony described even the sub-$100,000 scenario as a “bullish” scenario.
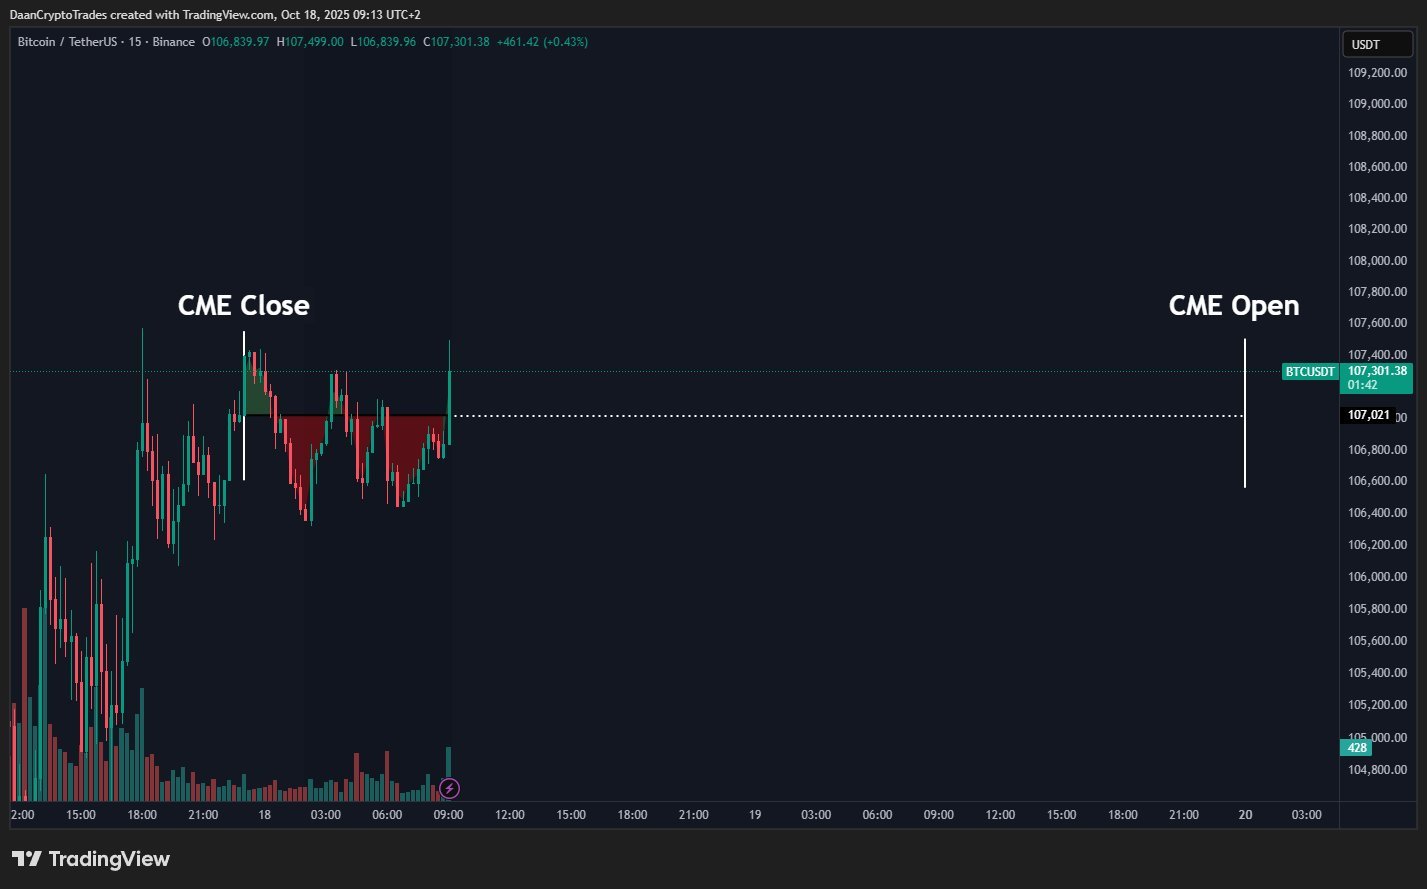
Fellow trading account Daan Crypto Trades still saw calmer conditions lasting until the weekly candle close.
“BTC did a good job recovering some ground on Friday before the CME close. This makes it so we’re likely to stick around this ~$107K level during the weekend,” it told X followers.
The post flagged $105,000 as the key nearby support level to hold, with crypto due for a more significant rebound if stocks led the way next week.
To that extent, the outlook was promising — the S&P 500 closed at 6,664 on Friday, having recovered around half of its losses from the week prior.
News that US President Donald Trump did not expect higher tariffs on China to last helped equities stabilize, while gold came off its latest all-time highs.
Can RSI deliver a BTC price bounce?
As Cointelegraph reported, another encouraging sign for Bitcoin came in the form of relative strength index (RSI) values.
Related: $120K or end of bull market? 5 things to know in Bitcoin this week
With daily RSI at its lowest since April, when BTC/USD fell to $75,000, the four-hour chart showed a clear bullish divergence developing.
As price made new local lows, RSI sought a higher low, indicating that sell-side pressure was declining below $110,000.
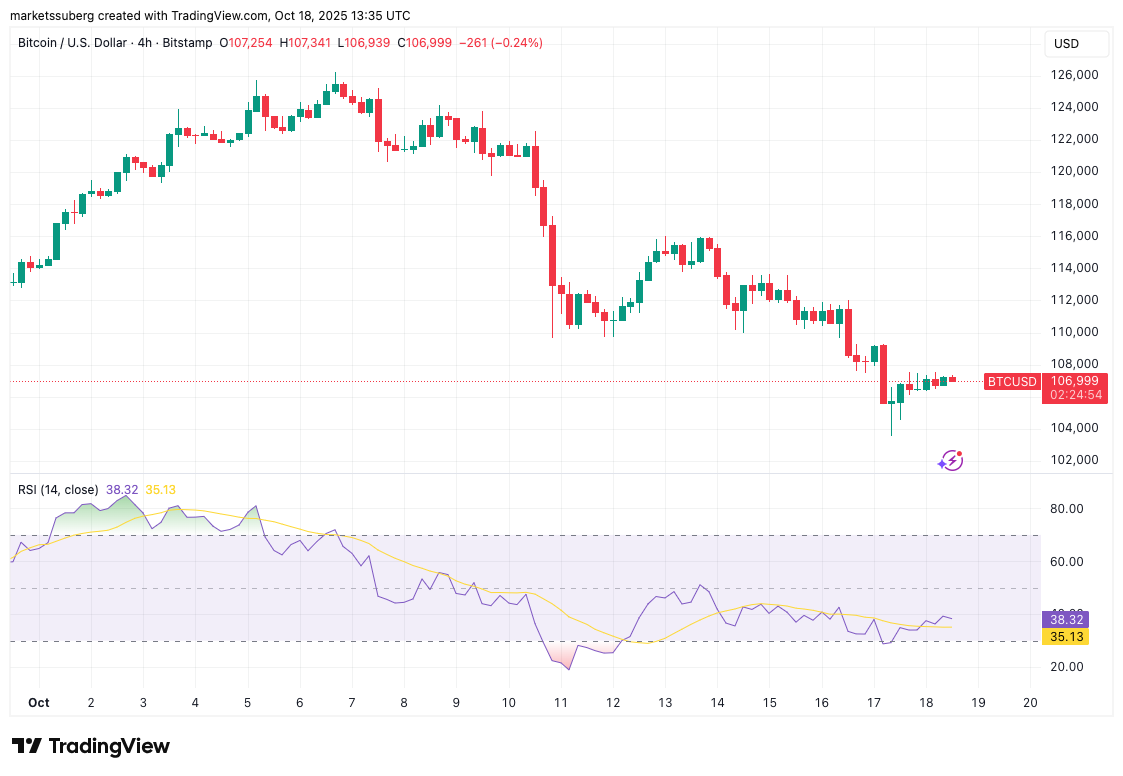
This led some to point out a conflict between bullish leading indicator data and overly bearish market sentiment.
Interesting, $BTC has confirmed a bullish divergence on the 6H & 8H and on 12H timeframe building on oversold RSI datapoints while sentiment is as depressed as Ive ever seen 🤔 pic.twitter.com/imvSXgSgsh
— 🀄Kriesz🀄 (@_Kriesz_) October 17, 2025
The Crypto Fear & Greed Index hit 22/100 Friday, marking its first trip into the “extreme fear” zone since April.
This article does not contain investment advice or recommendations. Every investment and trading move involves risk, and readers should conduct their own research when making a decision.
