


Key takeaways:
-
Long-term Bitcoin holders have sold 400,000 BTC over the past 30 days.
-
Short-term Bitcoin holders panic-sell $3 billion in BTC at a loss.
-
Bitcoin’s rising wedge targets $72,000 price as traders say BTC could drop as low as $60,000.
Bitcoin (BTC) declined on Tuesday, falling more than 3.5% over the last 24 hours to trade at $104,000. This brings the weekly and 30-day losses to 8% and 17%, respectively.

This drawdown has been accompanied by selling from long-term holders, who have offloaded more than 400,000 BTC over the past month.
Bitcoin long-term holders sell $42 billion in BTC
Bitcoin long-term holders (LTHs), entities holding coins for at least six months without selling, offloaded after the BTC price hit new all-time highs above $126,000 in early October.
Related: Crypto whale who nailed the October crash opens $55M BTC and ETH longs
Analyzing the LTH supply change, CryptoQuant analyst Maartunn said that on a rolling 30-day basis, the supply had decreased by a net 405,00 BTC, worth around $42.3 billion at current market prices as of Tuesday.
This represents “almost 2% of the total supply,” said crypto market commentator TFTC in response to Maartunn’s analysis, adding:
“Bitcoin is in a material supply distribution phase, and the price is still holding strong above $100,000.”
TFTC founder Marty Bent said, “The fact that the market can absorb this amount of sell pressure without nuking 30%-50%” is a positive signal for Bitcoin.
Still, short-term holders were also under pressure as they sent over 26,800 BTC (worth about $3 billion) to exchanges at a loss over the last three days.
🚨 Short Term Holder Capitulation
28,600 BTC ($2.98B) is sent to exchanges at a loss by STH. pic.twitter.com/zLmfE0lzhp
— Maartunn (@JA_Maartun) November 4, 2025
This activity highlights a familiar behavioral pattern in which STHs, often referred to as “weak hands,” tend to panic-sell during market dips, frequently incurring losses.
As Cointelegraph reported, short-term holders are now sitting on growing unrealized losses and are likely to continue selling if the downtrend continues.
Bitcoin’s falling wedge pattern targets $72,000
The weekly chart shows the BTC/USD pair validating a falling wedge, after the price lost support from the pattern’s lower trendline at $114,550.
Bulls are now fighting to keep the price above the 50-week simple moving average (SMA), currently at $103,300.
Other key lines of defense are the $100,000 psychological level and the 100-week SMA at $82,000.
A weekly close below this area will clear that path for BTC’s drop toward the wedge’s target at $72,000, representing a 30% decline from the current price.
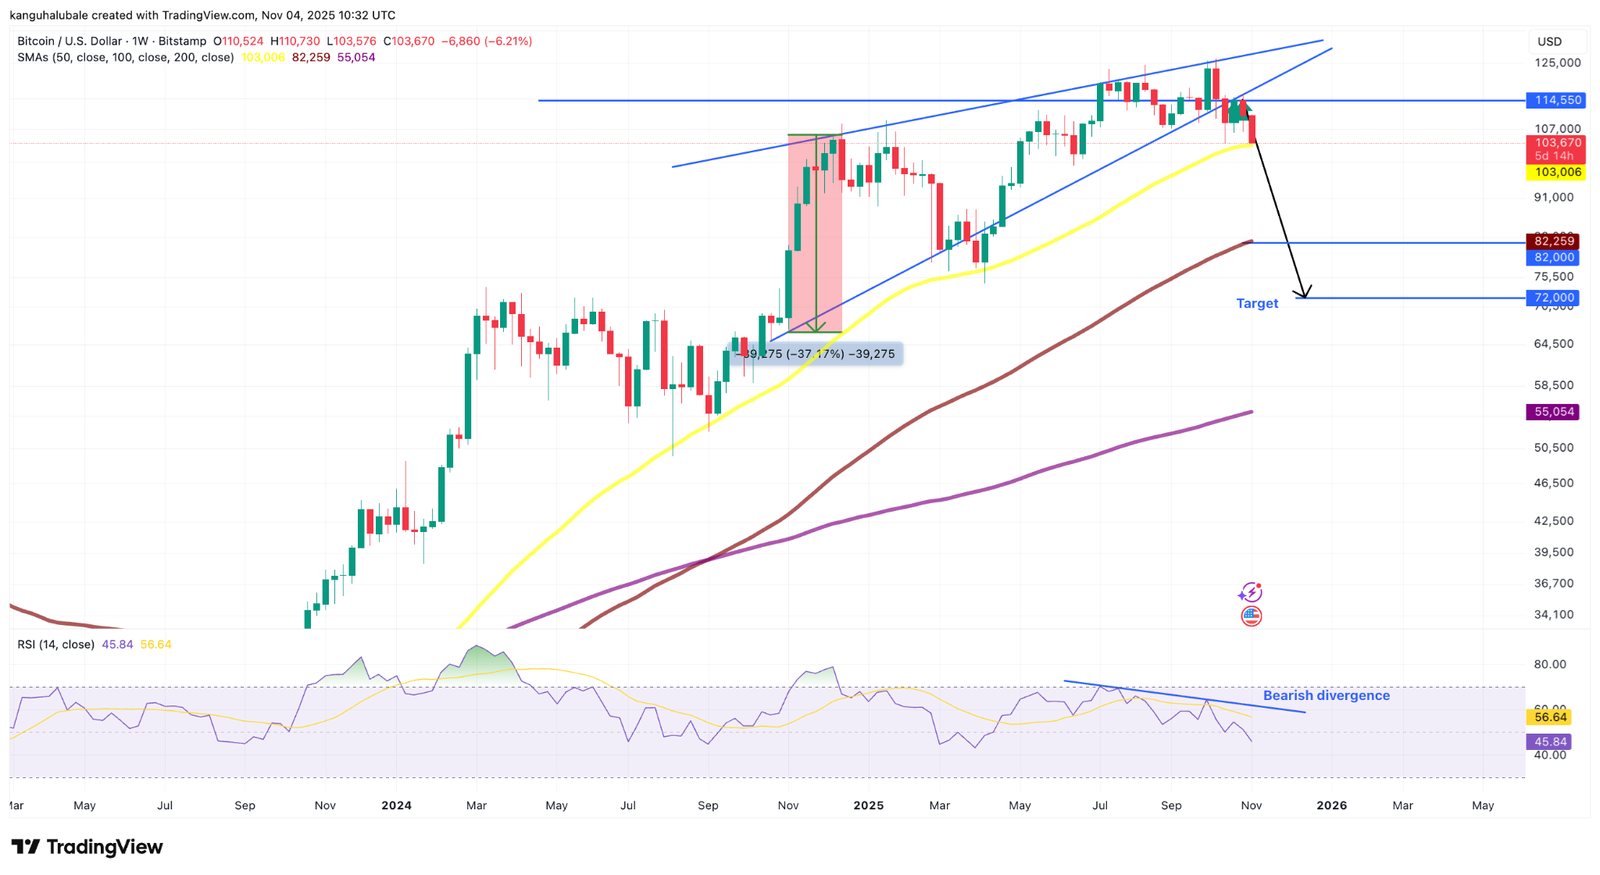
Bitcoin’s bearishness is preceded by a growing bearish divergence between its price and the relative strength index (RSI).
The weekly chart above shows that the BTC/USD pair rose between mid-July and early October, forming higher lows. However, during the same period, its weekly RSI declined from 70 to 45, resulting in lower lows, as illustrated in the weekly chart above.
A divergence between rising prices and a falling RSI usually indicates weakness in the prevailing uptrend, prompting traders to sell more at local highs as profit-taking intensifies and buyer exhaustion sets in.
Using the power law model, technical analyst JDK Analysis asked veteran trader Peter Brandt to weigh in on how low Bitcoin price could go.
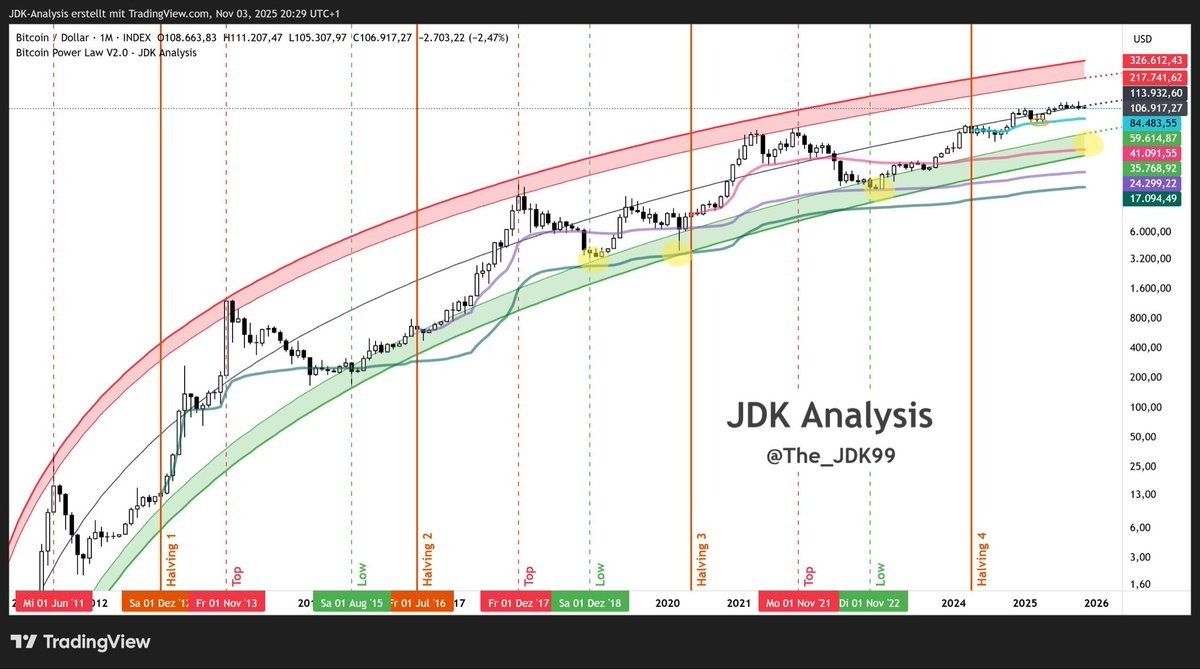
Brandt replied that Bitcoin could bottom at “the upper green band” of the model around $60,000, adding:
“I hope you are right about the top not being in yet.”
As Cointelegraph reported, crypto sentiment has plummeted into the “extreme fear” zone at 21, following Bitcoin’s drop below $104,000, with calls for a sub-$100,000 BTC price growing louder.
This article does not contain investment advice or recommendations. Every investment and trading move involves risk, and readers should conduct their own research when making a decision.
