


Key points:
-
Bitcoin futures markets fill a CME gap from mid-August, the latest sign of market strength.
-
Bulls must avoid turning that level into resistance, or new local lows await, analysis says.
-
BTC price all-time highs could come in a matter of weeks.
Bitcoin (BTC) hit a key price target on Saturday as analysis went on record to predict fresh all-time highs.

Bitcoin price outlook mixed with CME gap done
Data from Cointelegraph Markets Pro and TradingView showed BTC/USD spot hitting $116,800 on Bitstamp.
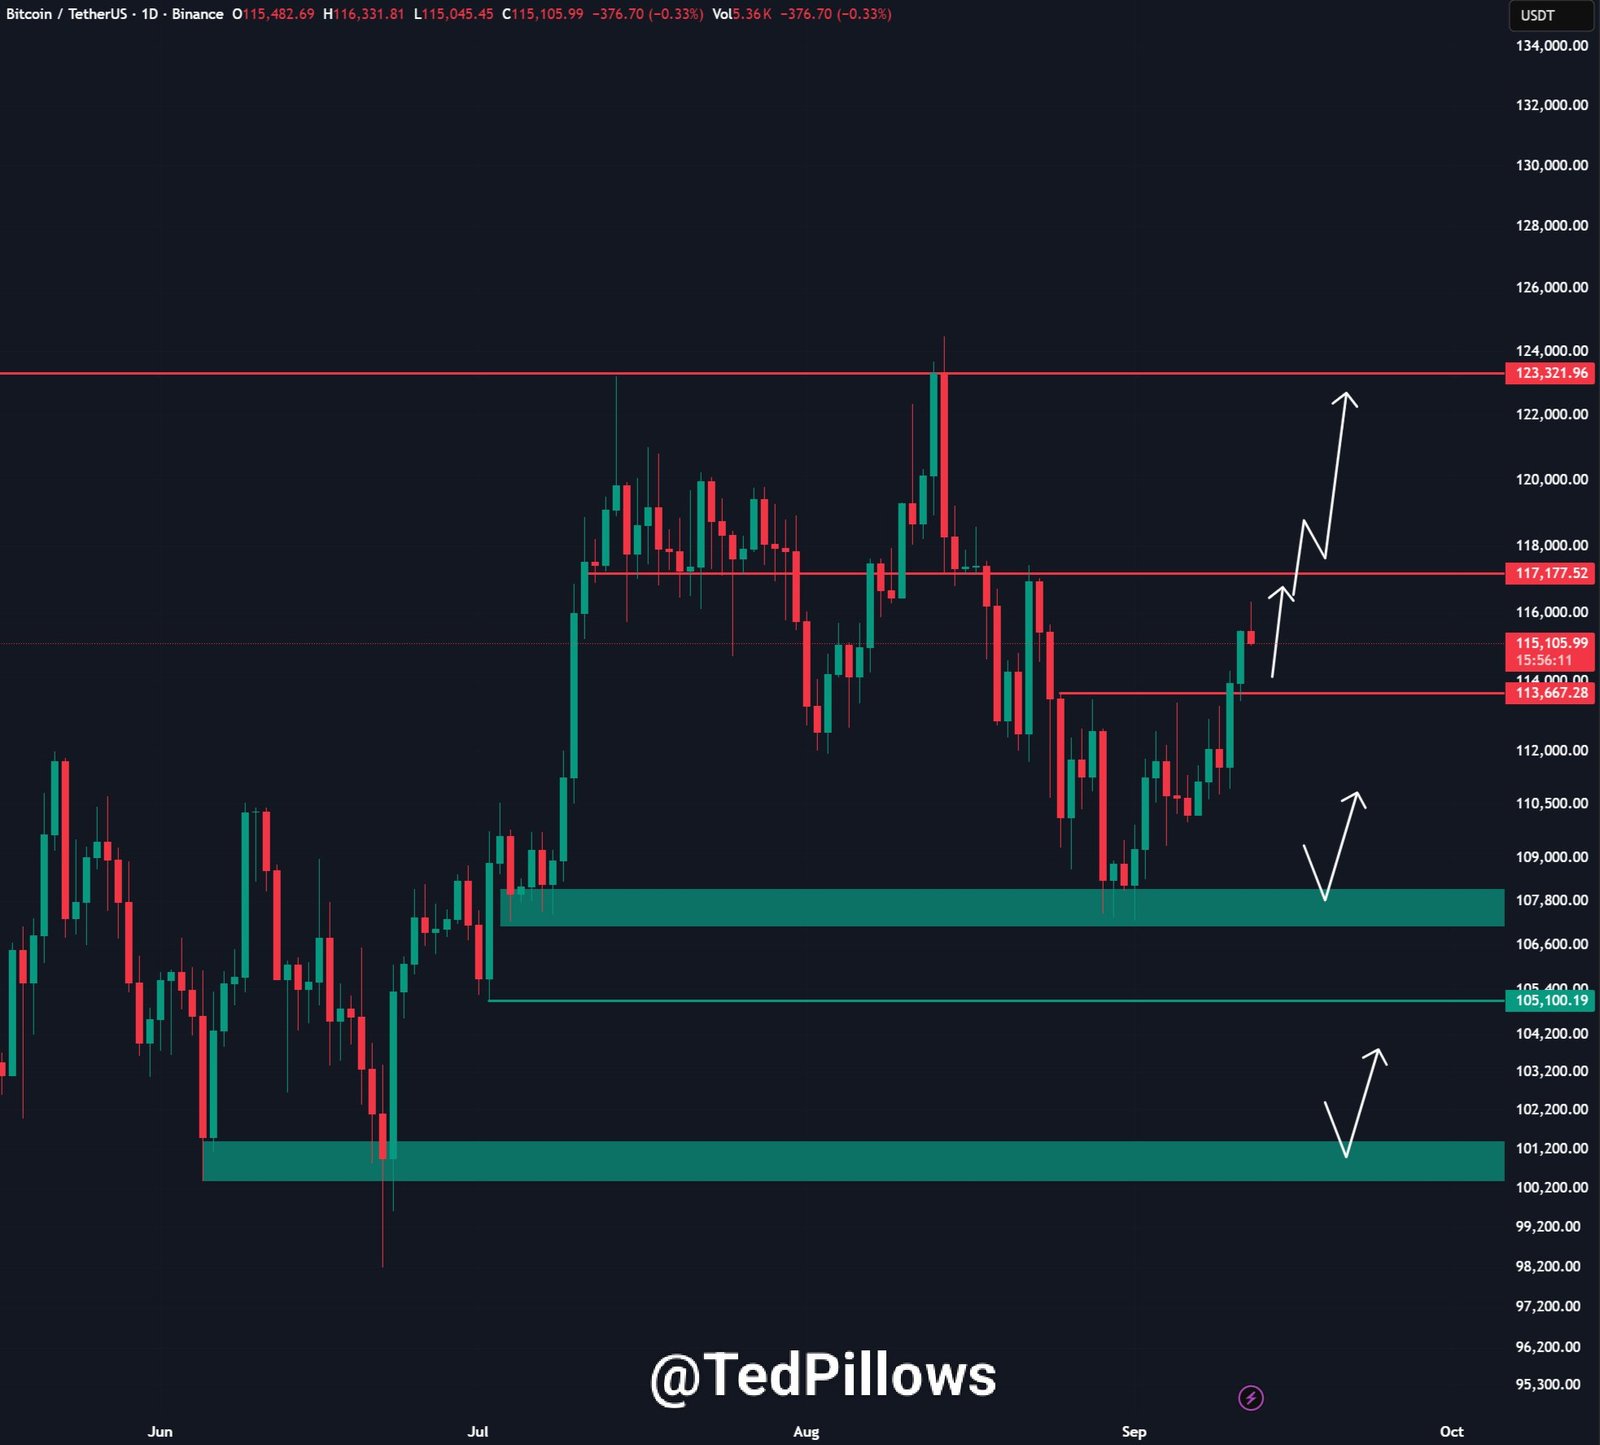
However, Bitcoin futures stole the spotlight, reaching $117,320 and closing a major “gap” left over from a prior weekend.
Appearing around Aug. 23, the gap resulted from weekend BTC price downside, with futures gradually “filling” it over a three-week period.
“If BTC fully reclaims this level, the doors towards the new ATH will open,” crypto investor and entrepreneur Ted Pillows argued in a post on X prior to the move.
Pillows warned that if the price treats the top of the gap as resistance, it may result in a return to monthly lows under $108,000.
All-time highs were firmly back on the radar at the weekend, however, amid various signals rejecting the idea that the cycle top was in.
Keith Alan, co-founder of trading resource Material Indicators, told X followers that $124,500 was “not the top” for Bitcoin.
“Why? Because there is simply too much institutional demand, and that demand is growing,” he summarized.
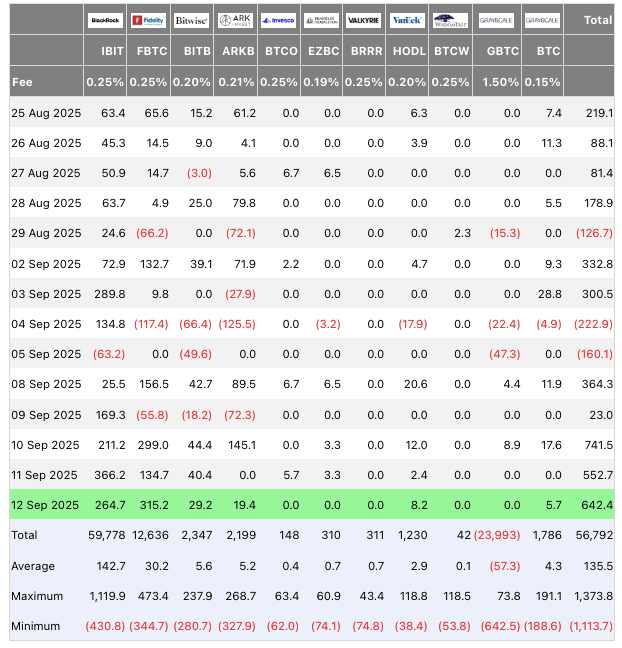
The US spot Bitcoin exchange-traded funds (ETFs) saw net inflows of over $2.3 billion in the five days through Sept. 12, per data from UK investment firm Farside Investors.
Alan also referenced upcoming interest-rate cuts by the US Federal Reserve, which, while not guaranteed, had 100% odds of occurring on Sept. 17, per data from CME Group’s FedWatch Tool.
“There will be volatility, and things are going to start getting spicy,” he added.
Traders count down to new all-time highs
Considering the timing for the all-time high, popular trader BitBull saw the process playing out in as little as two weeks.
Related: Bitcoin ‘sharks’ add 65K BTC in a week in key demand rebound
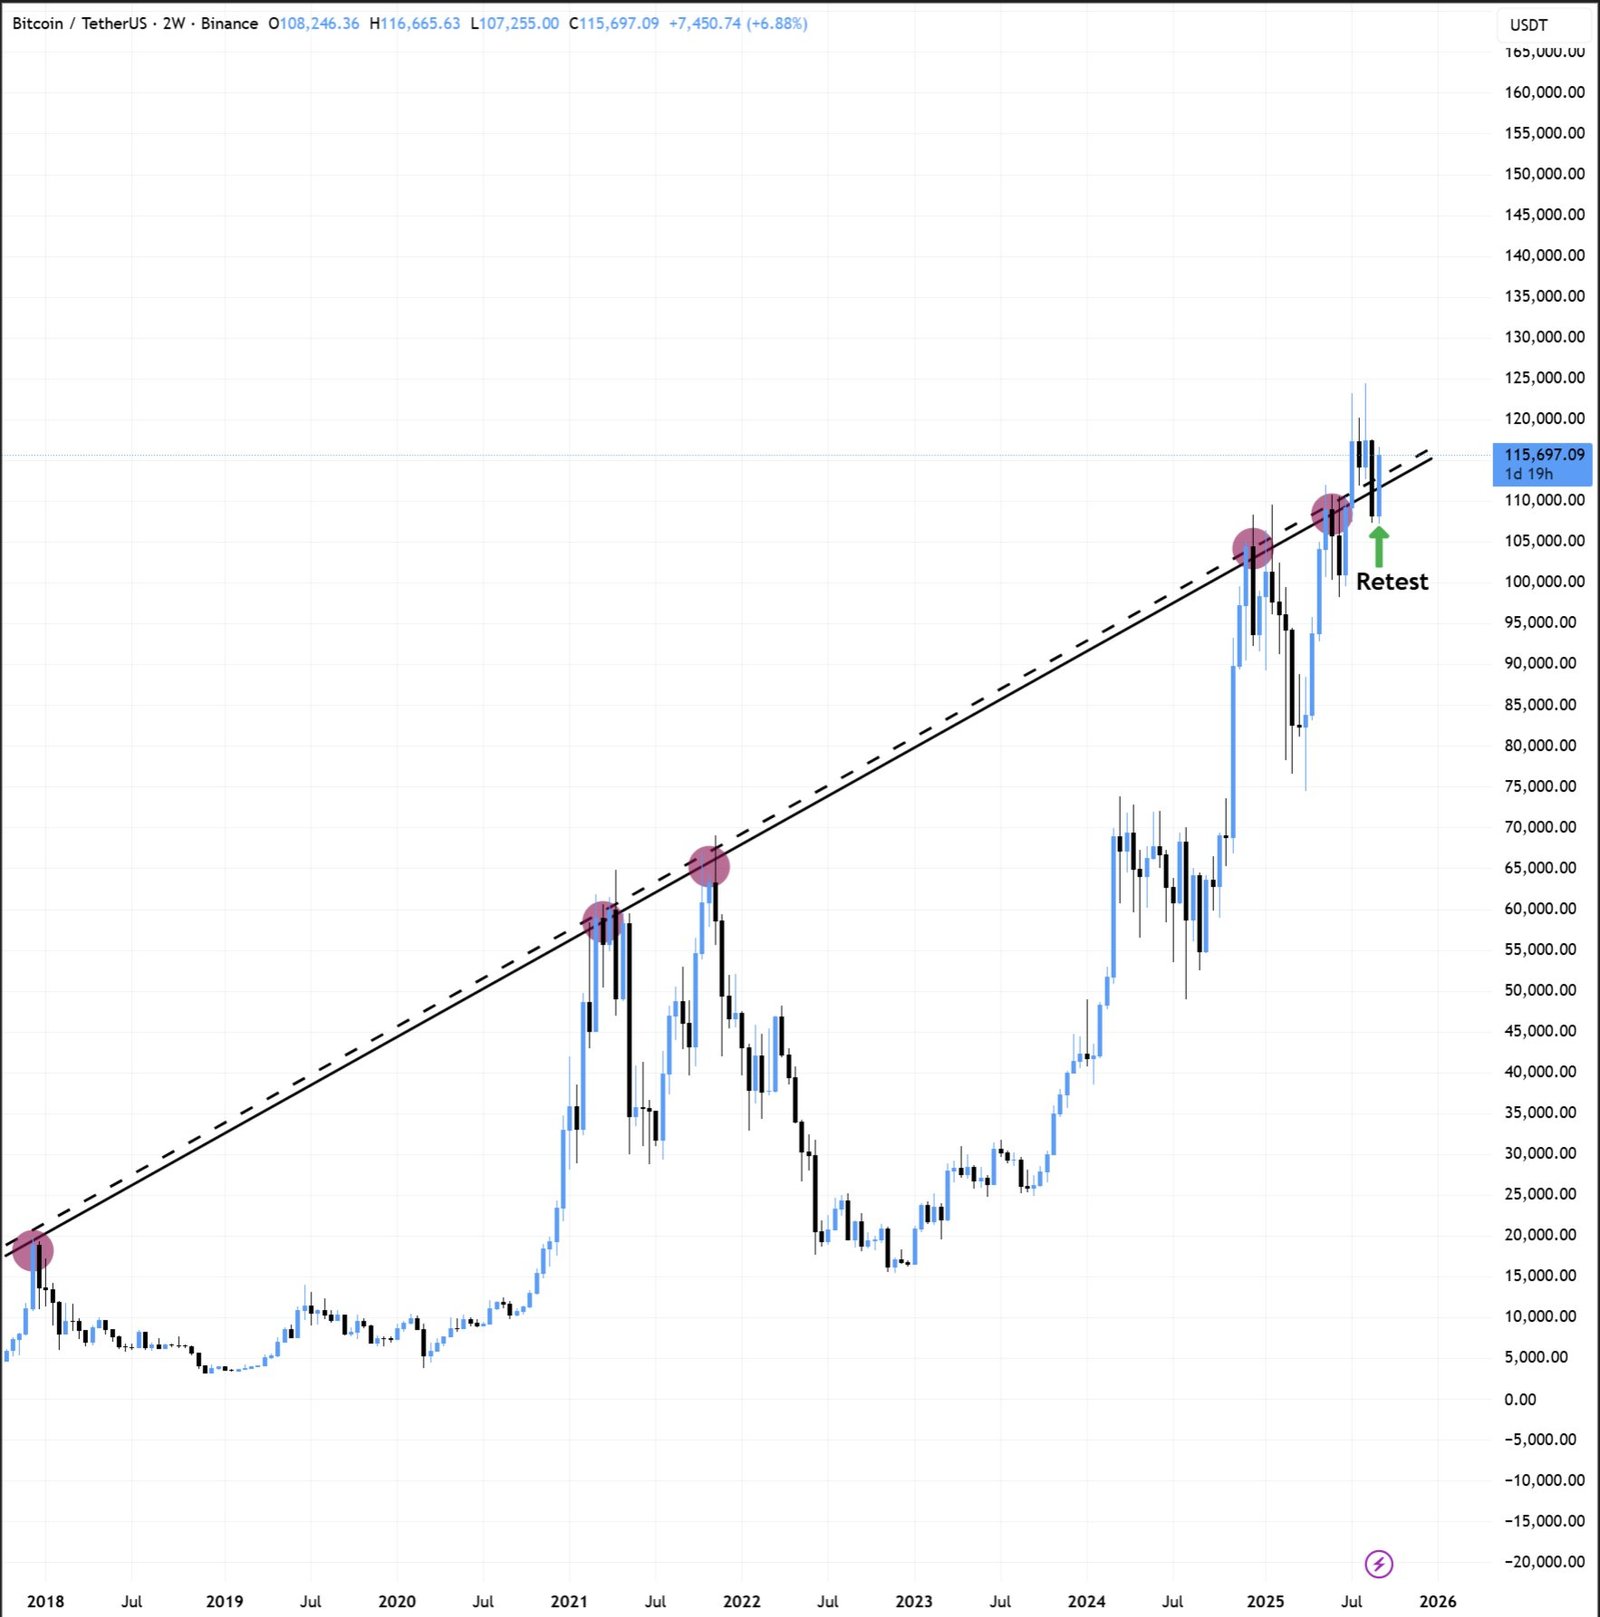
This, he said on the day, was due to BTC/USD reclaiming a key long-term trend line after briefly losing it in August.
“$BTC has reclaimed its 8-yr trendline level. It has a breakout in July, and last month BTC lost this key level. But now, bulls have closed a strong candle,” he explained alongside an accompanying chart.
“This shows BTC momentum is very strong, and a new ATH could happen in 2-3 weeks.”
Earlier this week, popular trader and analyst Rekt Capital likewise said that the bull market top was not yet in, referencing historical patterns.
This article does not contain investment advice or recommendations. Every investment and trading move involves risk, and readers should conduct their own research when making a decision.
