


Key points:
-
Bitcoin breaks through its volume-weighted average price (VWAP), echoing the rebound from April’s sub-$75,000 lows.
-
Stocks see fresh all-time highs as markets digest the Fed rate cut.
-
Liquidity suggests that volatility is incoming as BTC price targets $118,000.
Bitcoin (BTC) eyed $118,000 at Thursday’s Wall Street open as stocks hit new all-time highs.

Bitcoin breakout sets the stage for new all-time highs
Data from Cointelegraph Markets Pro and TradingView showed BTC/USD consolidating daily gains above key resistance.
The first US trading session after the Federal Reserve enacted its first interest-rate cut of 2025 saw both the S&P 500 and Nasdaq Composite Index hit fresh records.
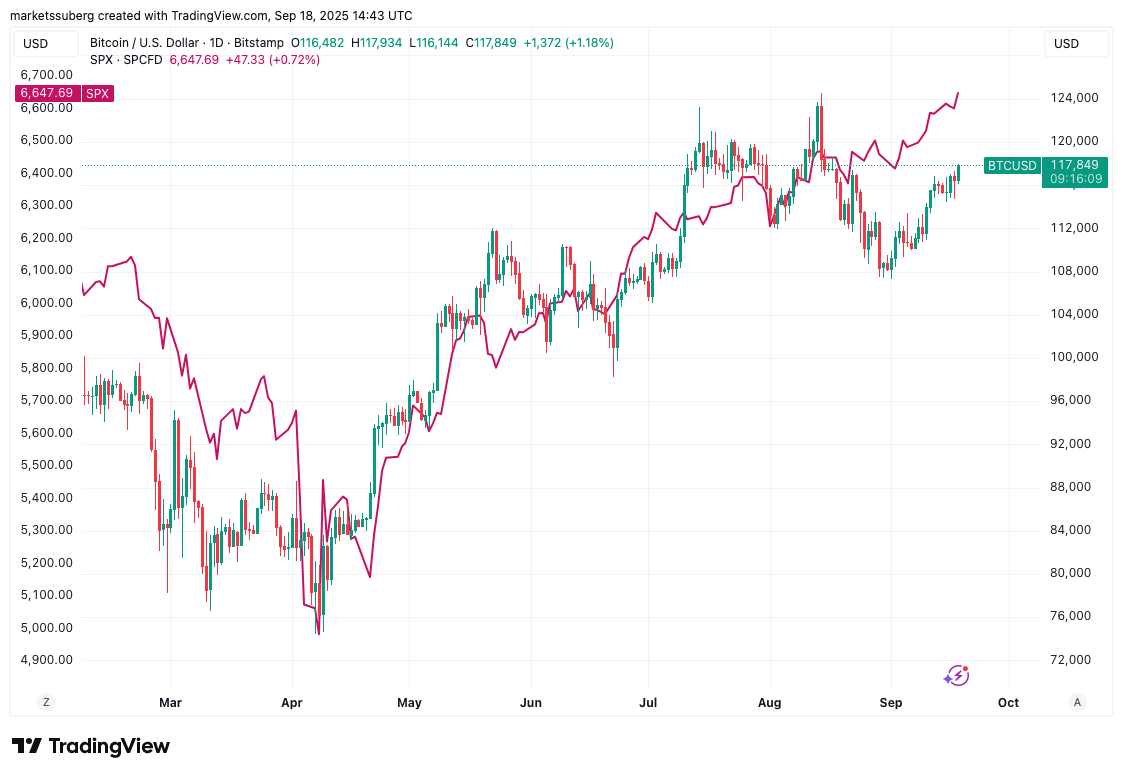
Reacting, trading resource The Kobeissi Letter saw the risk-asset uptrend continuing into next year.
“2025 now marks the 3rd year since 1996 where rate cuts have happened with the S&P 500 at record highs. The previous 2 years? 2019 and 2024,” it observed in part of its latest analysis on X.
“When the Fed cuts rates within 2% of all time highs, the S&P 500 has risen an average of +14% in 12 months.”
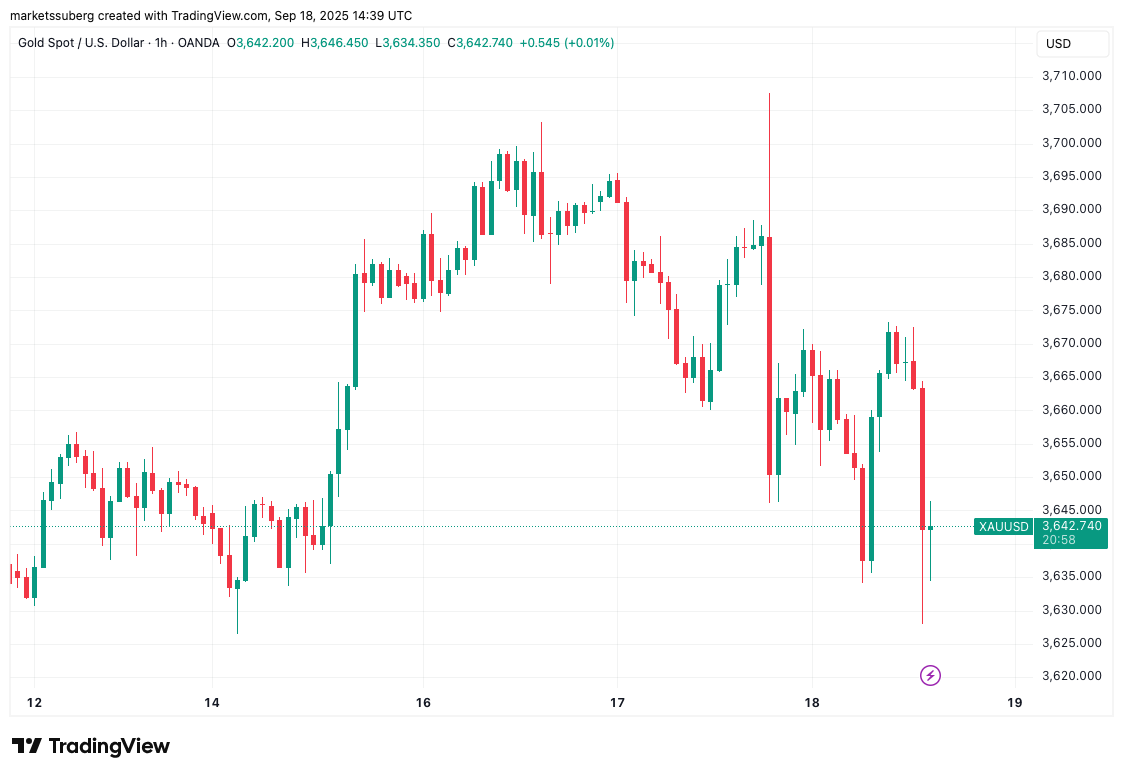
Gold saw further volatility after beating all-time highs of its own the day prior, with $3,700 the level in focus.
Bitcoin bulls meanwhile attempted to cement $117,000 as support while staring down the final block of resistance before price discovery.
$BTC – #Bitcoin is looking really interesting right now.
It’s trying to reclaim the ~$117K level.
Once we gain this level the way to $120K is open in my opinion.
However: Last time we rejected this level and came all the way back to the light blue zone. pic.twitter.com/zHxQzst0V4
— Crypto Caesar (@CryptoCaesarTA) September 18, 2025
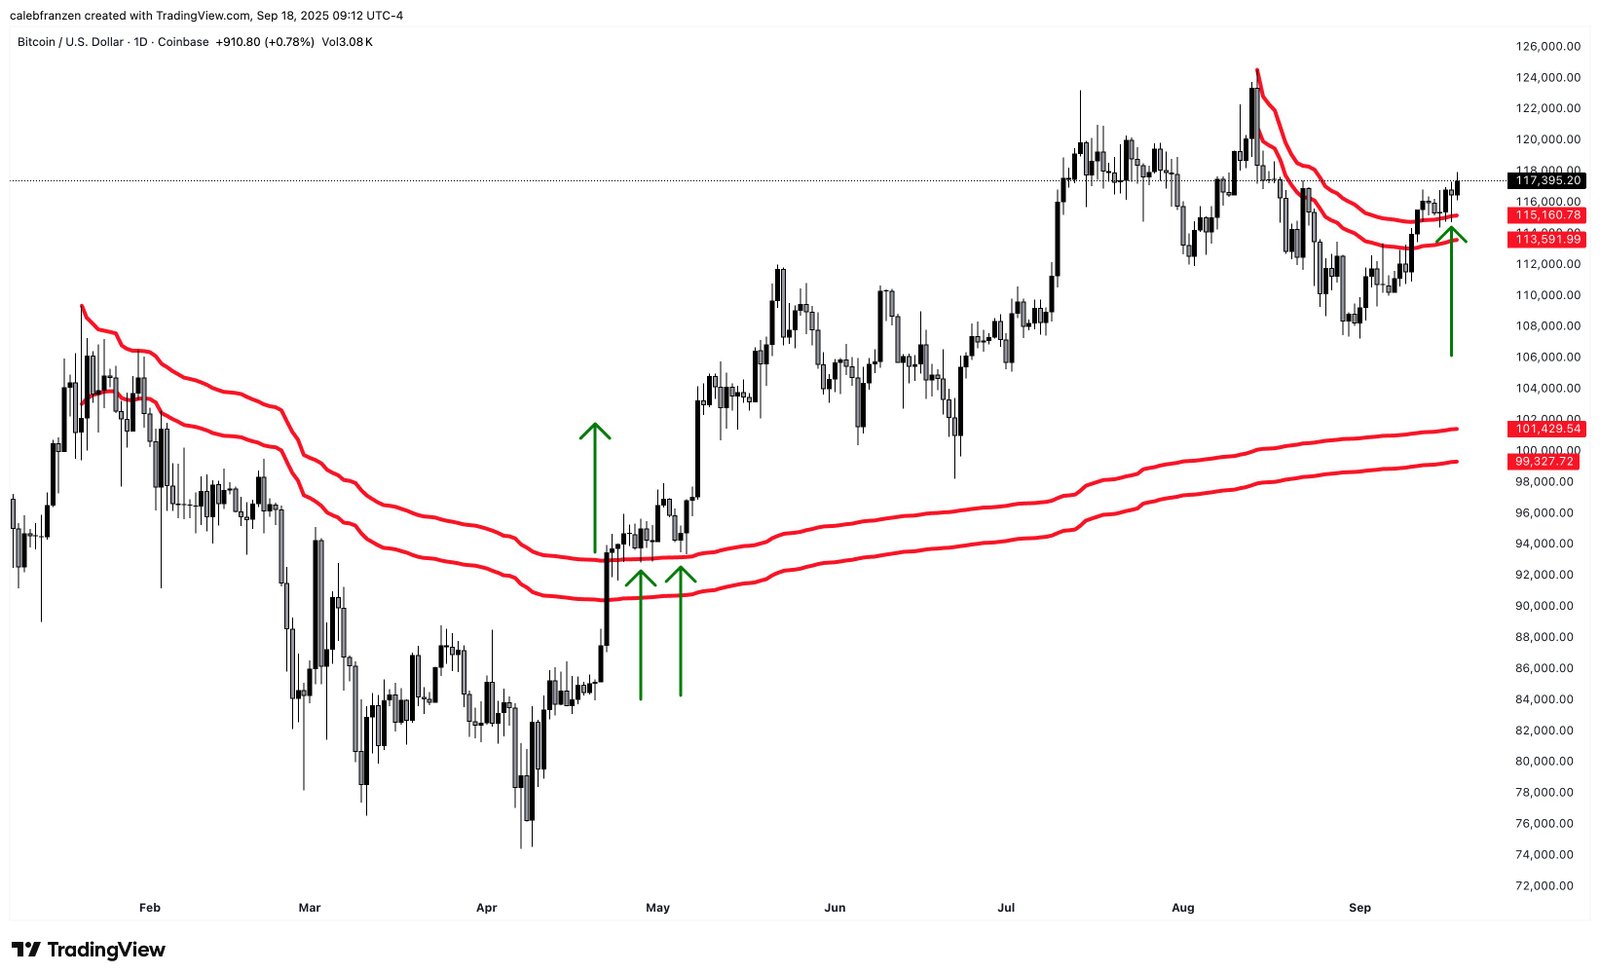
Caleb Franzen, creator of financial research resource Cubic Analytics, saw BTC/USD repeating a bullish pattern from May.
Then, as now, price broke above its volume-weighted average (VWAP) as measured from its latest all-time high.
“It’s almost like good things have happened since Bitcoin broke above its anchored volume-weighted average price from the ATHs,” he summarized on X alongside an explanatory chart.
Warning over BTC price “exit pump”
A word of caution came from exchange order-book analysis.
Related: Bitcoin price gains 8% as September 2025 on track for best in 13 years
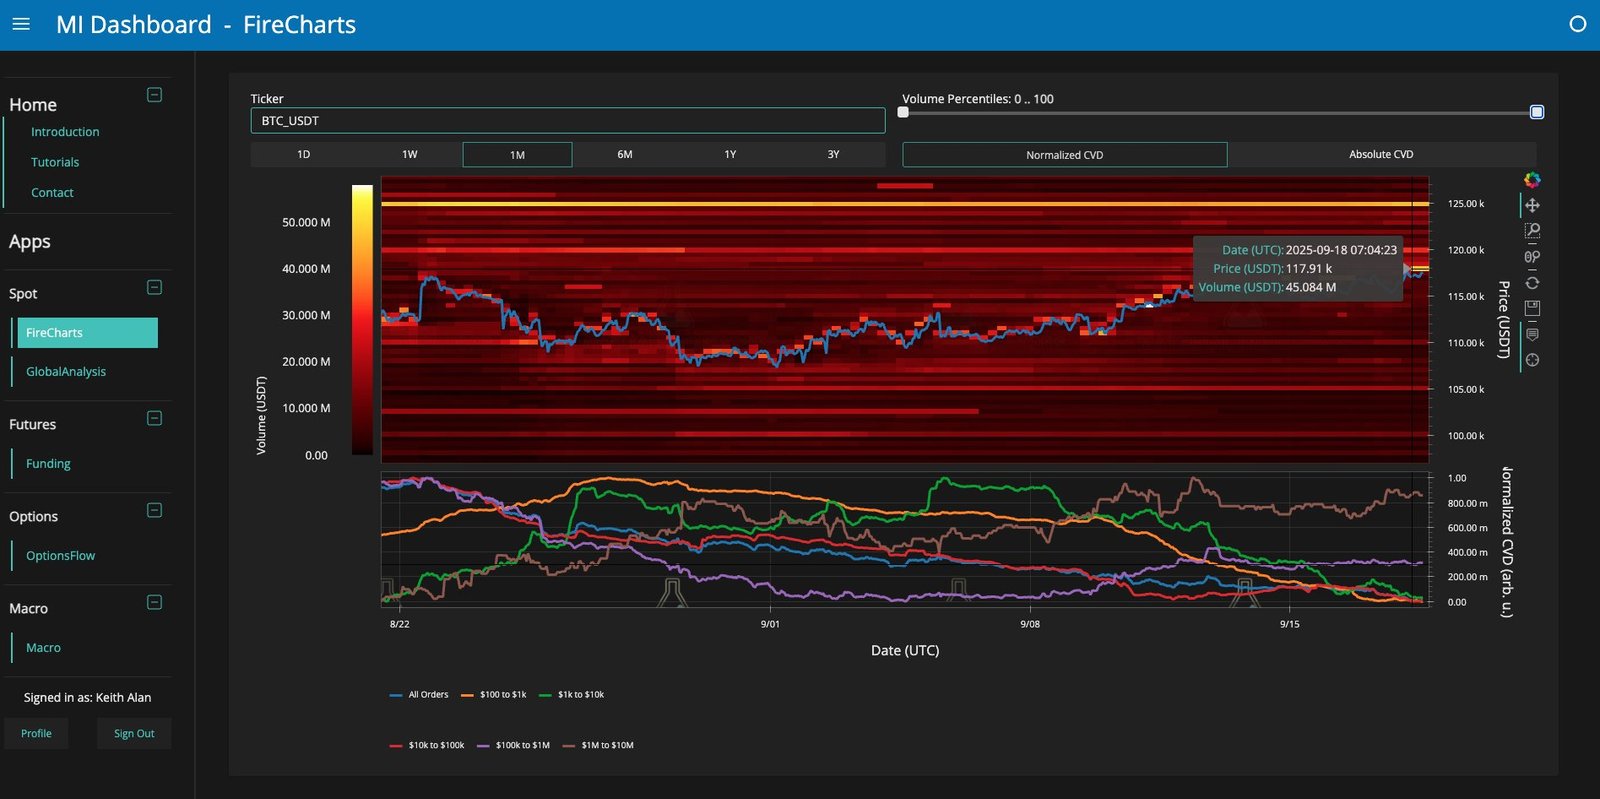
Trading resource Material Indicators was among those warning that liquidity was building around price, potentially opening the door for volatile moves.
“While I feel like the macro is solidly bullish and the top isn’t in yet, this currently feels more like a short term exit pump, than accumulation. Time will tell,” part of accompanying commentary stated.
Earlier, Cointelegraph reported on thickening order-book liquidity, with $116,500 and $119,000 the levels to watch.
This article does not contain investment advice or recommendations. Every investment and trading move involves risk, and readers should conduct their own research when making a decision.
