


Key points:
-
Bitcoin stays volatile into the Wall Street open with $110,000 making a reappearance.
-
Liquidity conditions thicken around price as the 21-week moving average now important to reclaim.
-
Gold price tumbles from a rematch with all-time highs.
Bitcoin (BTC) buyers and sellers fought for control at Tuesday’s Wall Street open as gold fell hard.

Bitcoin bounces after rematch with CME futures gap
Data from Cointelegraph Markets Pro and TradingView showed BTC price volatility heating up.
After dropping toward the weekend gap in CME Group’s Bitcoin futures market — but not filling it — BTC/USD reversed upward, passing the $110,000 mark.
The pair surfed changing liquidity conditions on exchange order books, with both bids and asks coming and going as entities attempted to influence price performance.
Data from monitoring resource CoinGlass revealed overall liquidity thickening around the spot price.
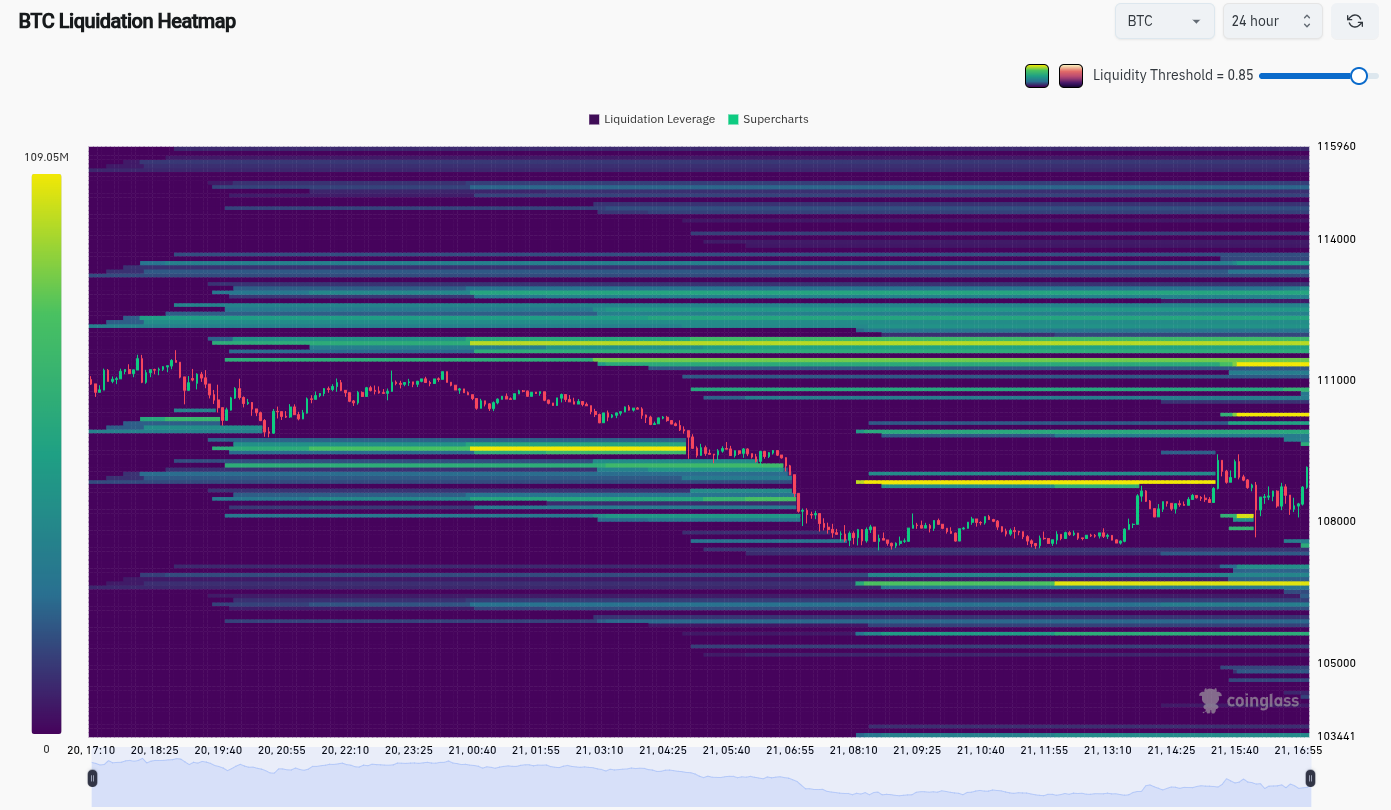
“Been a while since liquidations have looked like this with funding rates around negative territories,” trader Luca wrote on the topic in an X post.
The post referenced funding rates across derivatives exchanges, indicating a risk-off mentality among traders, with an overall expectation of further downside to come.
Both Luca and others noted a large potential price “magnet” in the form of asks at $116,000 and above.
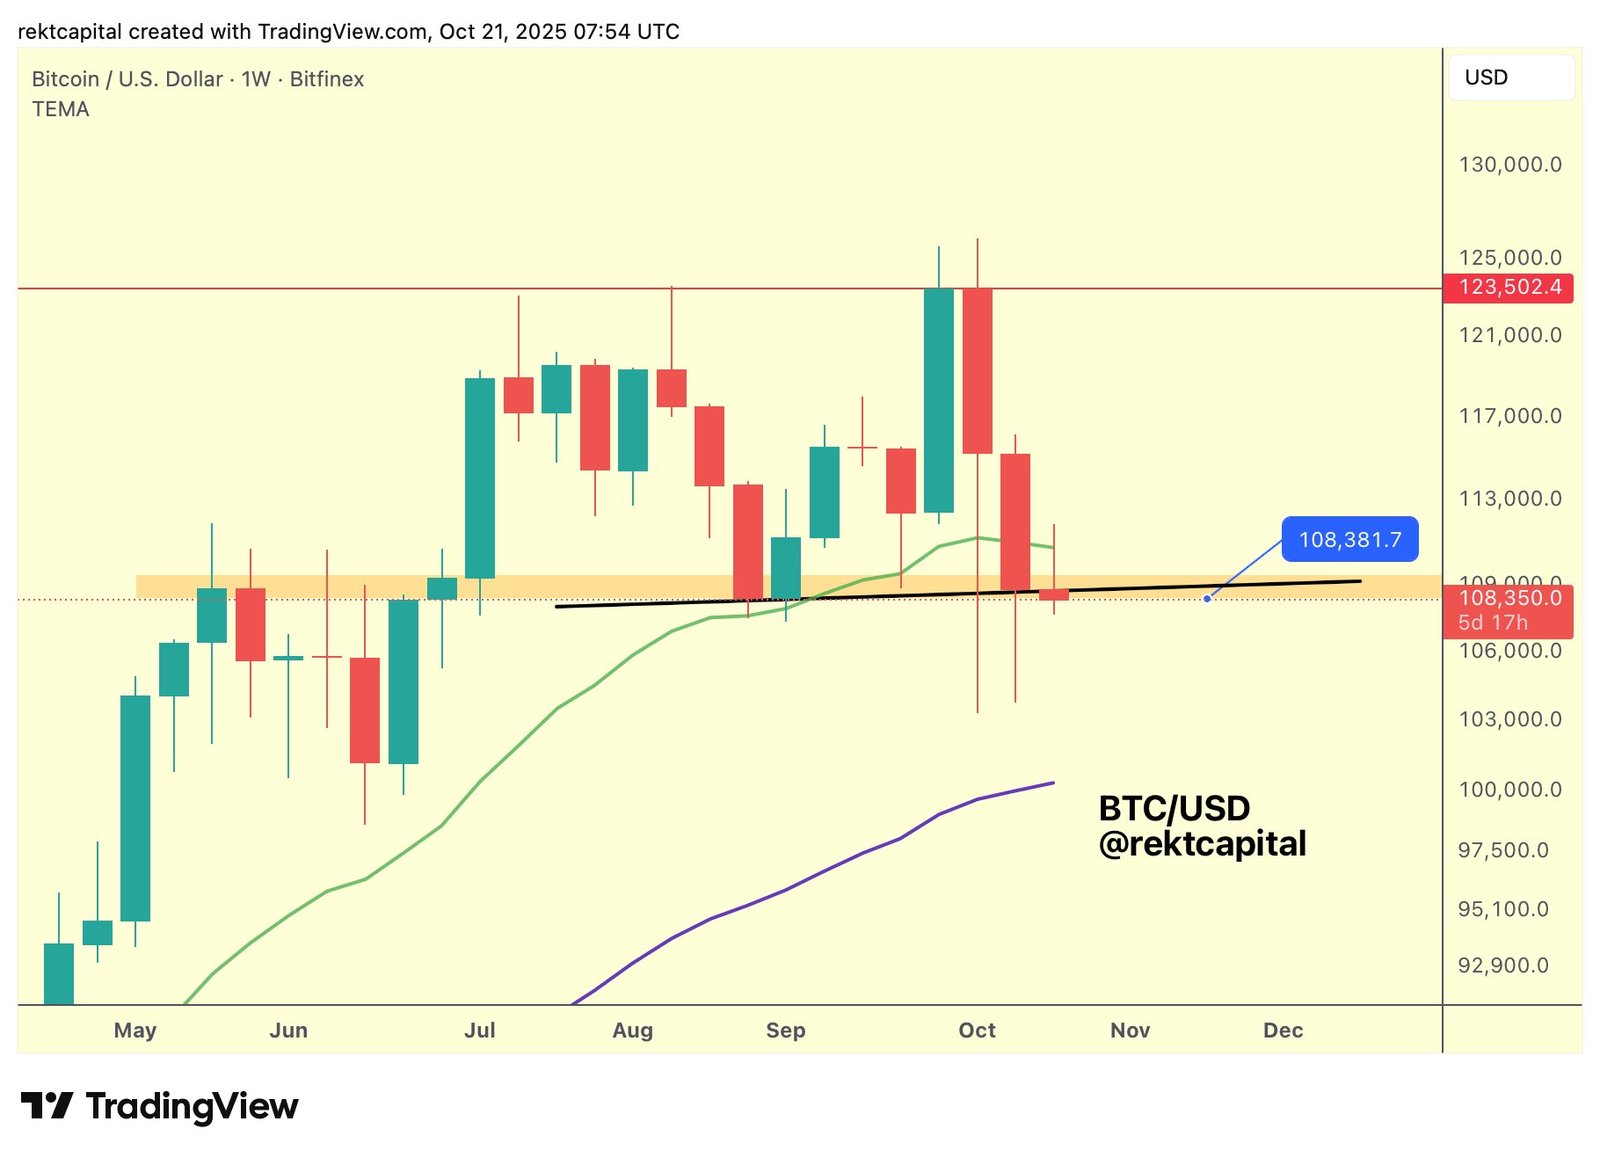
Trader and analyst Rekt Capital, meanwhile, flagged the 21-week exponential moving average (EMA) as the key resistance level for bulls to beat.
“Bitcoin is finding resistance at the 21-week EMA (green) for the moment which is pressing price back into the historical demand area (orange),” he wrote alongside a chart.
“Bitcoin needs to continue holding orange as support to not just retain a potential early-stage Higher Low but position itself for a reclaim of the 21-week EMA later.”
Gold “double top” in sight as daily dip hits 5%
Volatility was not only confined to crypto markets on the day.
Related: Ethereum fails again above $4K as traders grow frustrated with shakeouts
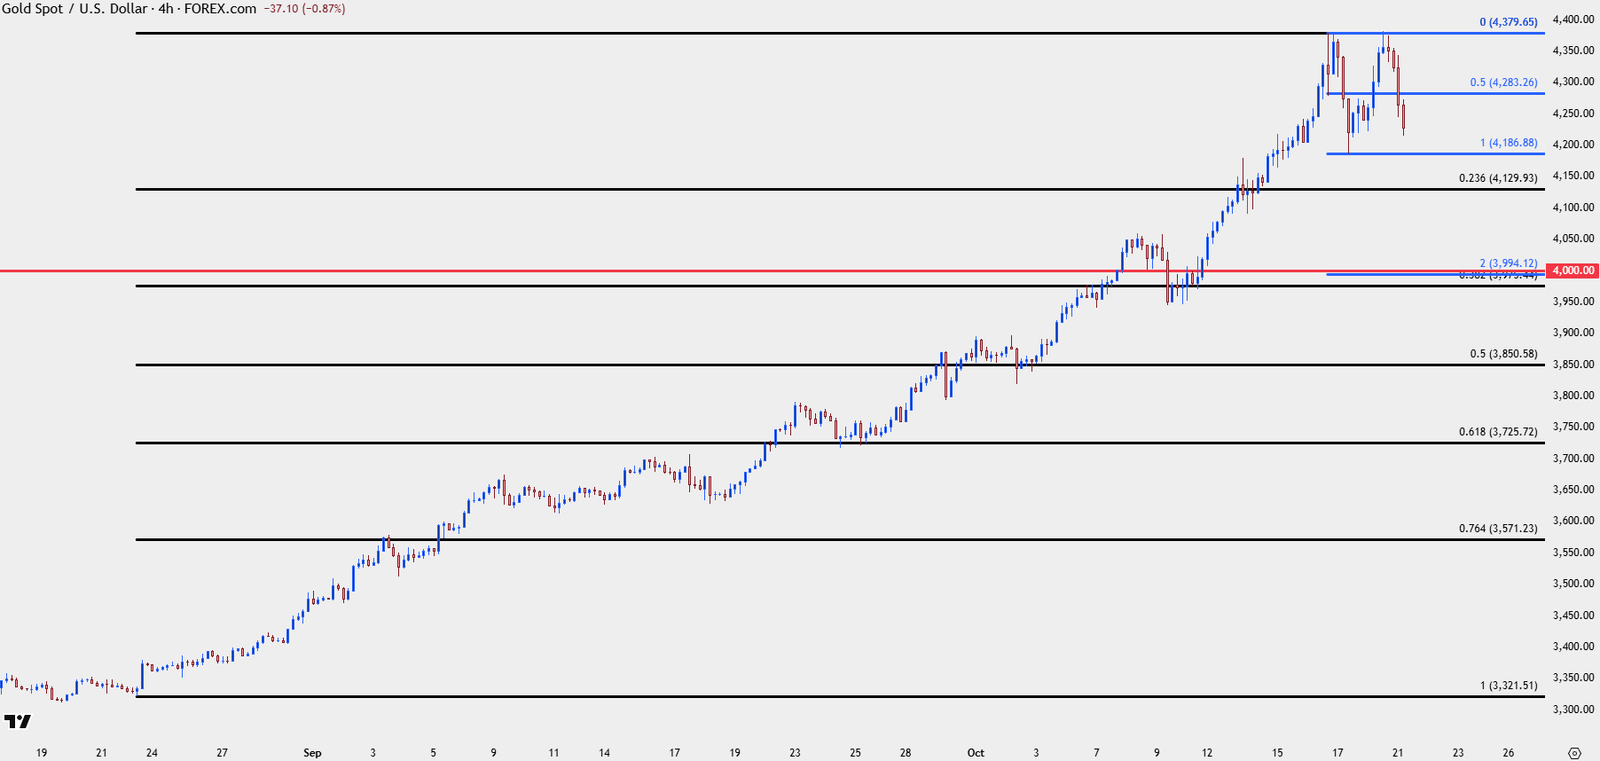
Gold, which had posted all-time highs in recent days, now found itself at risk of a “double top” bearish trend reversal after suffering more than 5.5% in daily losses.
$GOLD. Will the EQH turn into a Double Top? If so, the target is around 4K. pic.twitter.com/qlh7qm2x21
— HTL-NL 🇳🇱 (@htltimor) October 21, 2025
James Stanley, a senior strategist at Forex.com, was among those forecasting a retest of $4,000 if the structure played out.
“If neckline breaks and price clears to projected move, that’s a 4k test,” he told X followers in part of his latest X analysis, which featured Fibonacci retracement levels.
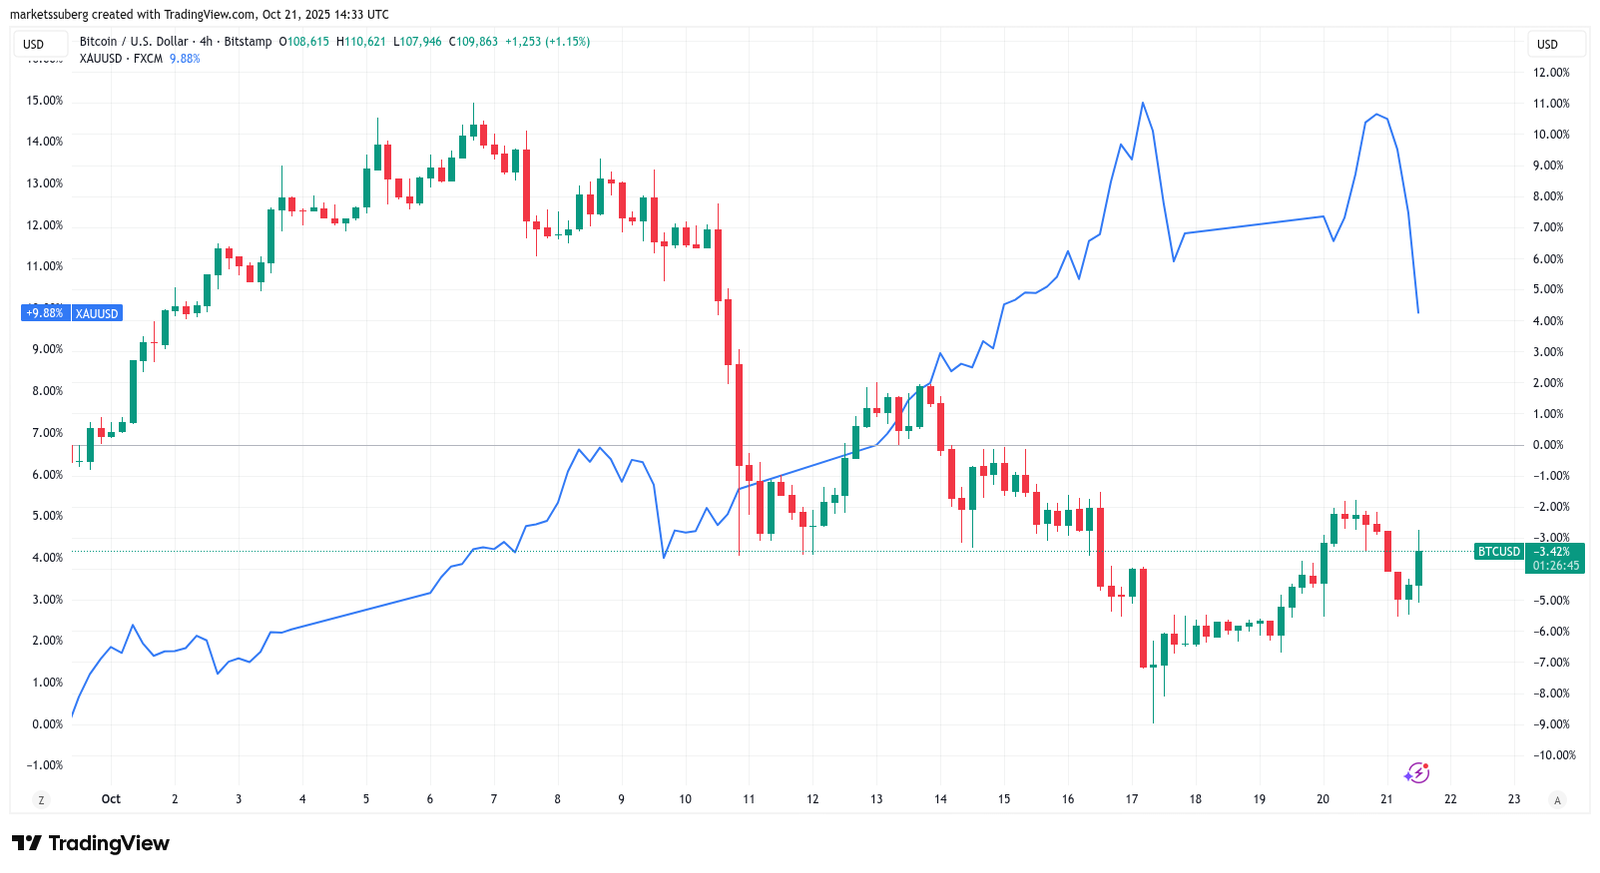
Trader Crypto Tony suggested that Bitcoin and altcoins could ultimately benefit from a cooling-off in gold’s historic bull run.
“Riskier asset classes hold more weight during uncertain times and GOLD is the top of this chain,” he wrote on X, seeing gold as the reason for crypto underperformance.
“Once this does pullback, expect a Crypto boom.”
This article does not contain investment advice or recommendations. Every investment and trading move involves risk, and readers should conduct their own research when making a decision.
