


Key takeaways:
-
The Binance Bitcoin/stablecoin ratio nears parity at 1, a rare market signal.
-
Market structure metrics show BTC price remains in a profit regime but is prone to consolidation.
-
A drop below $95,000 could trigger the first 50-week SMA bear signal this cycle.
The Binance Bitcoin/stablecoin ratio is approaching a rare threshold that has historically coincided with market bottoms. The metric, which tracks the balance of Bitcoin (BTC) reserves against stablecoin reserves on Binance, is nearing parity at 1, a level last observed in March, when Bitcoin pulled back to $78,000 before rallying toward its $123,000 all-time high.

Data from CryptoQuant indicates that this setup has appeared only twice since the last bear market, raising interest as a potential buy signal. However, the catch is that in past cycles, the ratio typically flashed at the end of bear markets in 2023 and more recently in March. Its reappearance in the current context could therefore risk a false signal, possibly hinting at the start of a prolonged correction rather than a bottom.
Supporting the ratio’s strength, Binance’s ERC-20 stablecoin reserves just hit a record $37.8 billion, reflecting steady inflows and deep liquidity. Investors on the exchange appear far from overexposed to BTC, reinforcing that capital is waiting on the sidelines.
At the same time, Bitcoin researcher Axel Adler Jr. cautioned that the market remains in a “repair phase.” The analyst noted that Bitcoin sits at $110,700, just above the short-term holder realized price of $107,600, a key monthly bull support zone.
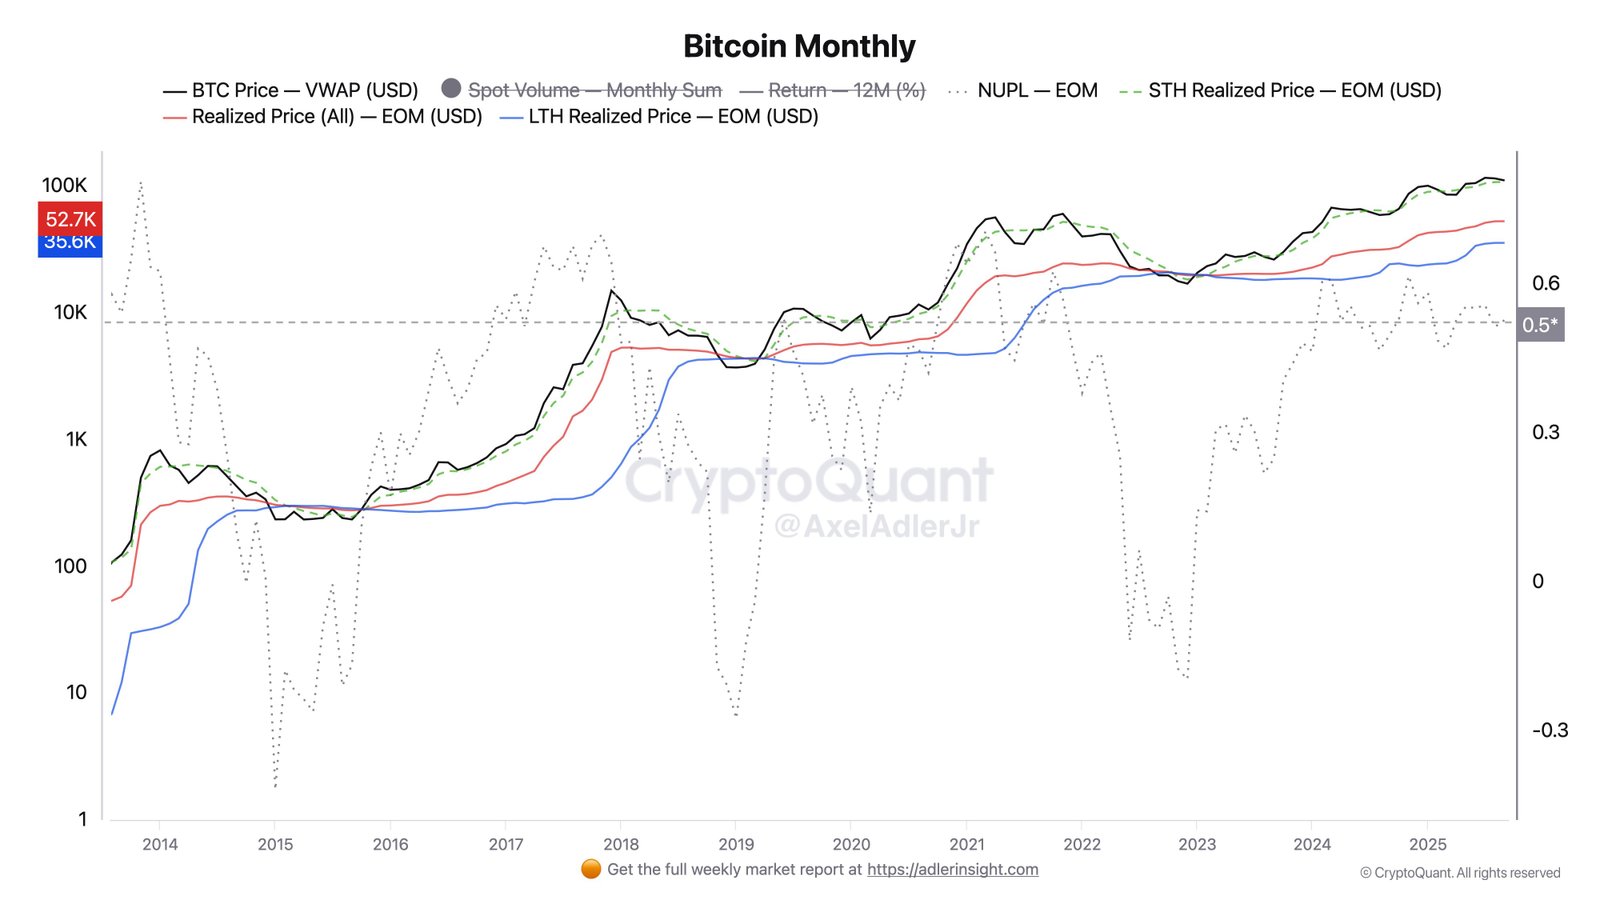
Structural indicators remain intact, with the overall realized price at $52,800 and long-term holder realized price at $35,600, both well below current levels. The net unrealized profit/loss (NUPL) ratio at 0.53 suggests the market is in a broad profit regime but still shy of euphoric extremes.
In short, higher timeframes remain bullish, but sensitivity to profit-taking means consolidation could extend. Whether the Binance ratio once again marks a turning point or instead signals turbulence will hinge on Bitcoin’s ability to hold key support.
Related: Bitcoin’s ‘euphoric phase’ cools as $112K becomes key BTC price level
Bitcoin’s 50-week SMA still defines the bear market risk
Another critical gauge for Bitcoin is the 50-week simple moving average (SMA), which has consistently signaled cycle shifts since 2018. Historical data shows that whenever Bitcoin closed a weekly candle below the 50-SMA, prolonged corrections followed, with a 63% drawdown in 2018 and a 67% decline in 2022. The only exception was in 2020, when BTC quickly rebounded after the COVID-19 pandemic-induced crash.
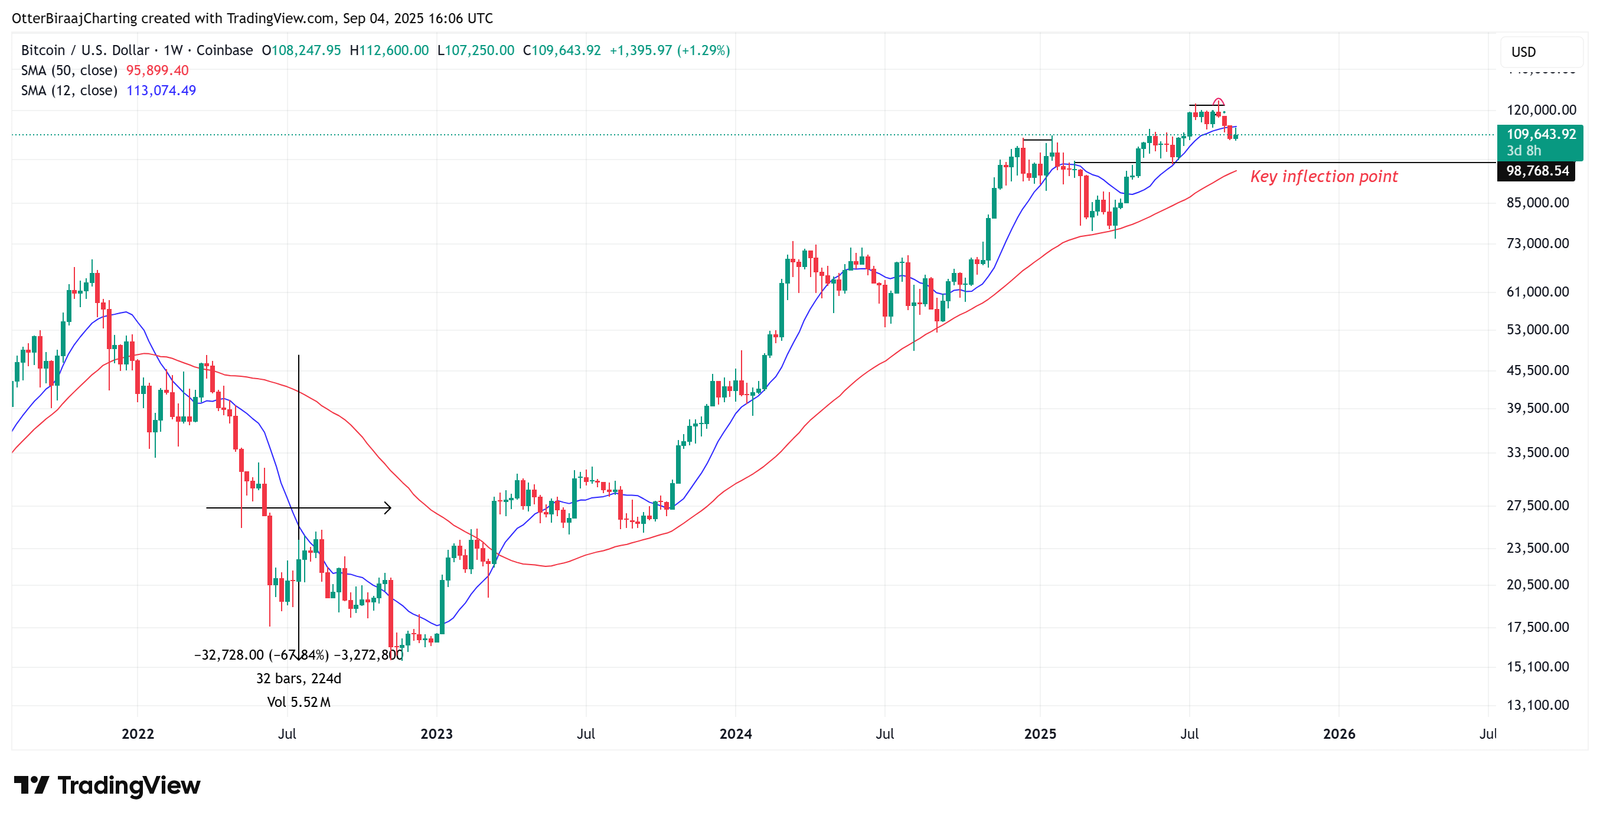
Since March 2023, Bitcoin has managed to stay above the 50-SMA, with key retests in August 2024 and March 2025 failing to produce a weekly close below the indicator. Based on adjusted levels, the analysis estimates that a drop into the $90,000 to $95,000 range could push BTC below the 50-SMA for the first time in this cycle.
Such a move would deliver the first clear-cut technical signal of a bear market, raising the stakes for whether current consolidation resolves higher or slides into deeper correction.
Related: Bitcoin bear market due in October with $50K bottom target: Analysis
This article does not contain investment advice or recommendations. Every investment and trading move involves risk, and readers should conduct their own research when making a decision.
