


Since a retest on its key medium-term “Expanding Wedge” range support on 22 August 2025, the AUD/USD has staged a minor bullish reversal and rallied by 3.2% (low to high) to print an intraday high of 0.6620 on Tuesday, 9 September 2025, on the backdrop of a broad-based weaker US dollar against other major currencies in anticipation of a Fed dovish pivot.
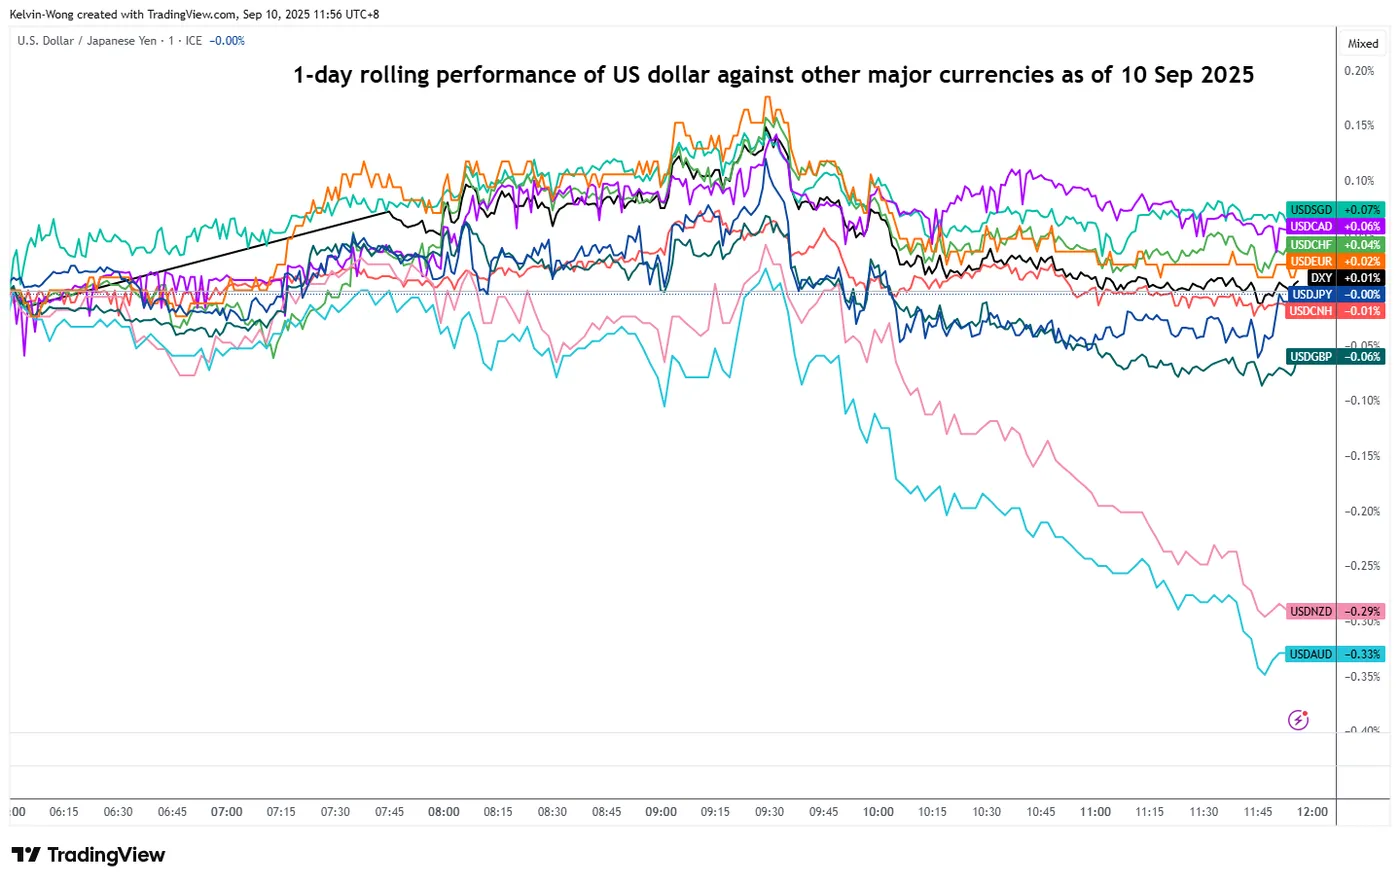
Fig. 1: One-day rolling performances of the US dollar against major currencies as of 10 Sep 2025 (Source: TradingView)


In today’s Asia session, on 10 September, the Australian dollar is the strongest-performing currency among the majors against the US dollar. Based on a one-day rolling performance, the USD/AUD cross rate has declined by -0.3%, much more than the US Dollar Index, which is trading almost unchanged (see Fig. 1).
The current upswing in AUD/USD has been reinforced by easing concerns over a potential deflationary spiral in China from the latest key inflationary trends data for August.
China’s core CPI has swung up further into growth territory
China inflation trend with AUD/USD
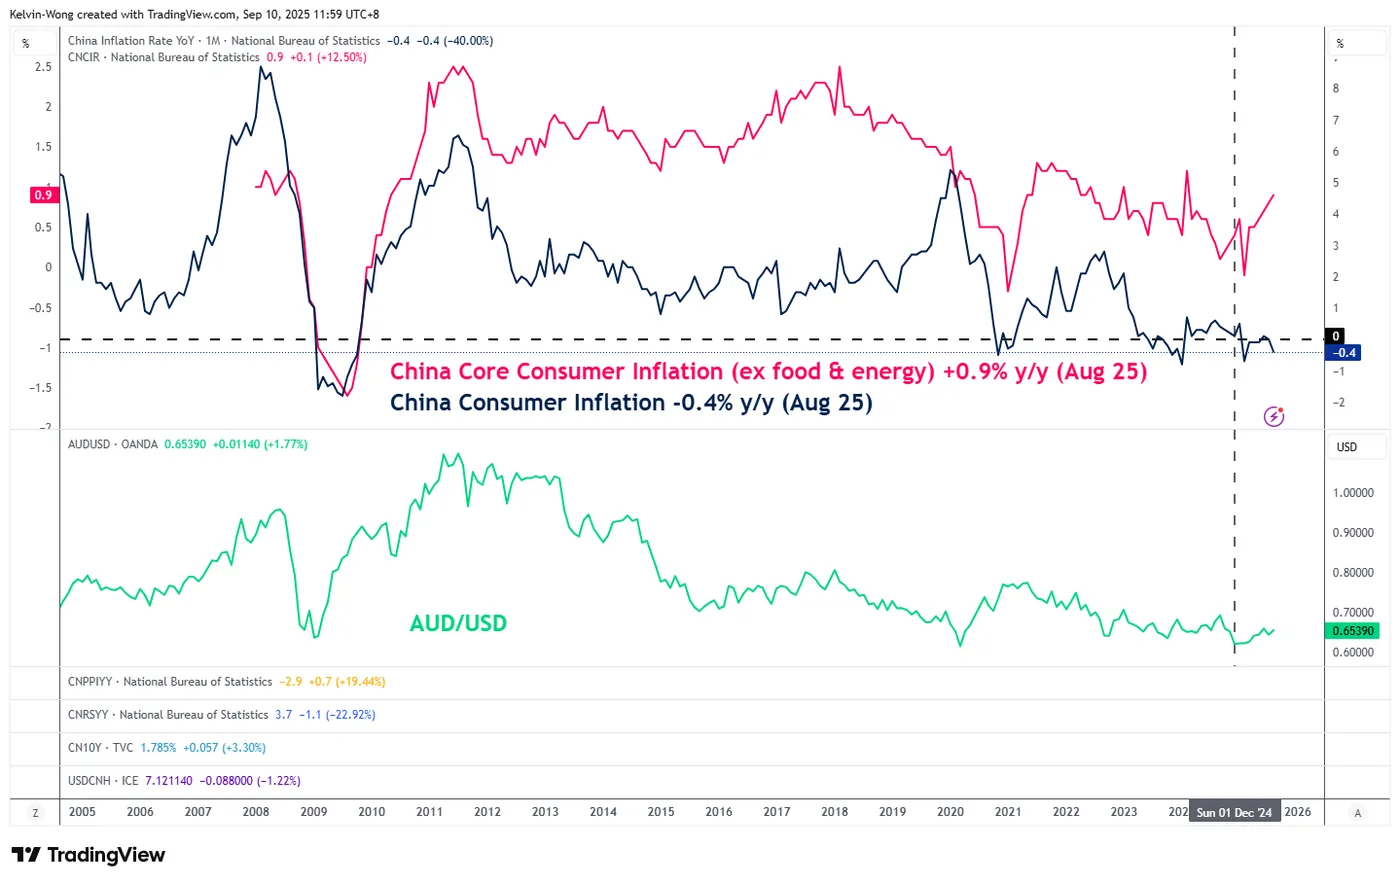
Fig. 2: China CPI and core CPI with AUD/USD as of 10 Sep 2025 (Source: TradingView)
China is a key trading partner of Australia, where a higher consumer demand from China on Australia’s raw minerals products is likely to exert upside pressure on the Aussie dollar.
Despite the weaker-than-expected headline China’s consumer prices (CPI) that dropped to -0.4% y/y in August from a flat reading in July, and missing forecasts of a -0.2% y/y fall, the core CPI (excluding food and energy) has improved to a further positive reading of 0.9% y/y in August from 0.8% y/y in July,
Overall, the core CPI trend in China has trended higher over the past six months, since the February 2025 print of -0.1% year-over-year. Interestingly, the long-term movement (monthly chart) of the AUD/USD has a direct correlation with the trend of China’s core CPI (see Fig. 2).
China’s improving core CPI trend is likely to lift consumer confidence, which has remained subdued since the post-COVID period and the property market downturn. A recovery in sentiment could drive stronger demand for Australia’s raw minerals, creating a positive feedback loop that supports further strength in the Aussie dollar.
Let’s now decipher the short-term trajectory (1 to 3 days) of the AUD/USD and its key levels to watch from a technical analysis perspective.
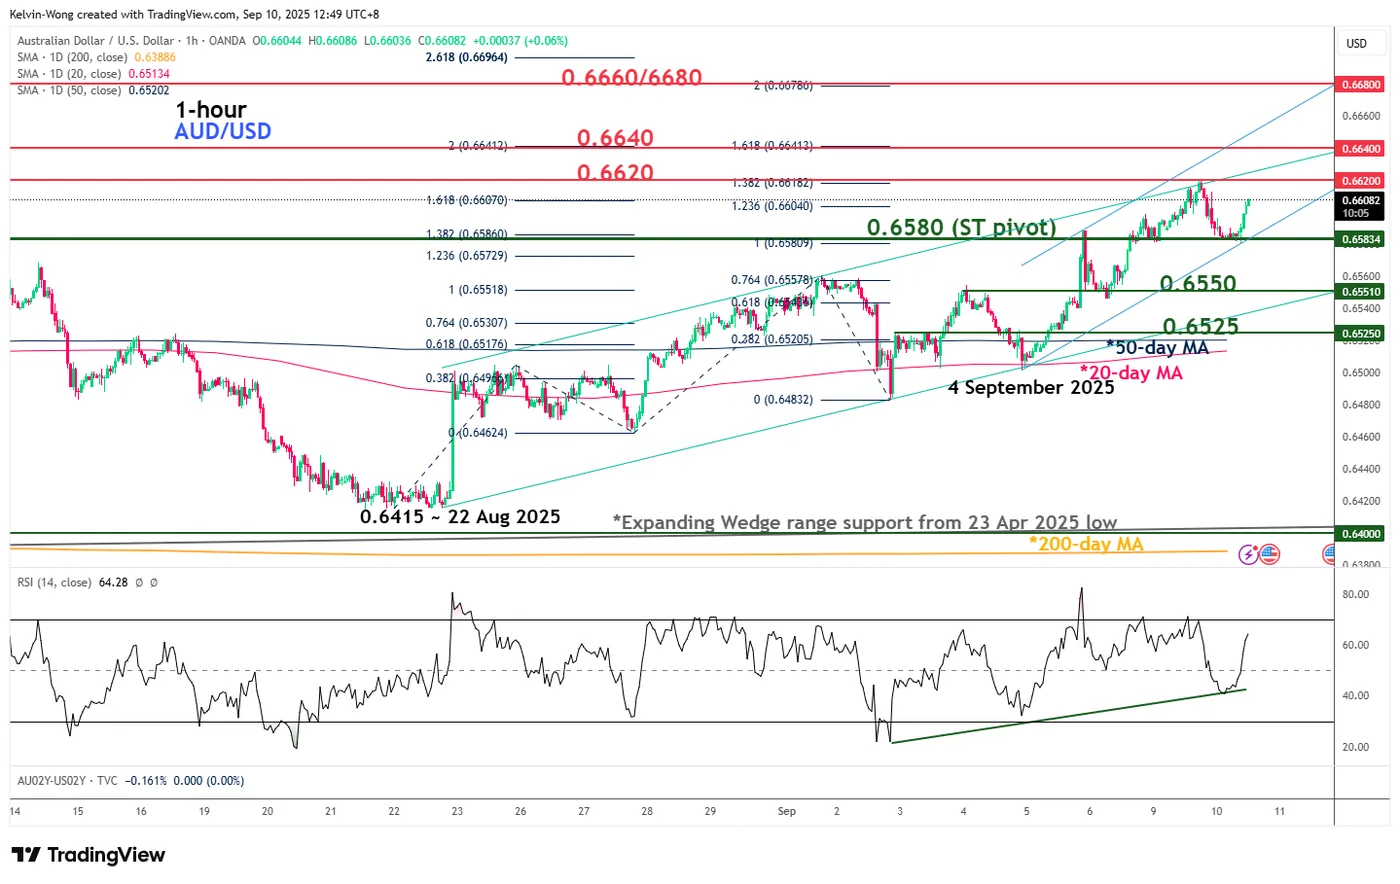
Fig. 3: AUD/USD minor trend as of 10 Sep 2025 (Source: TradingView)
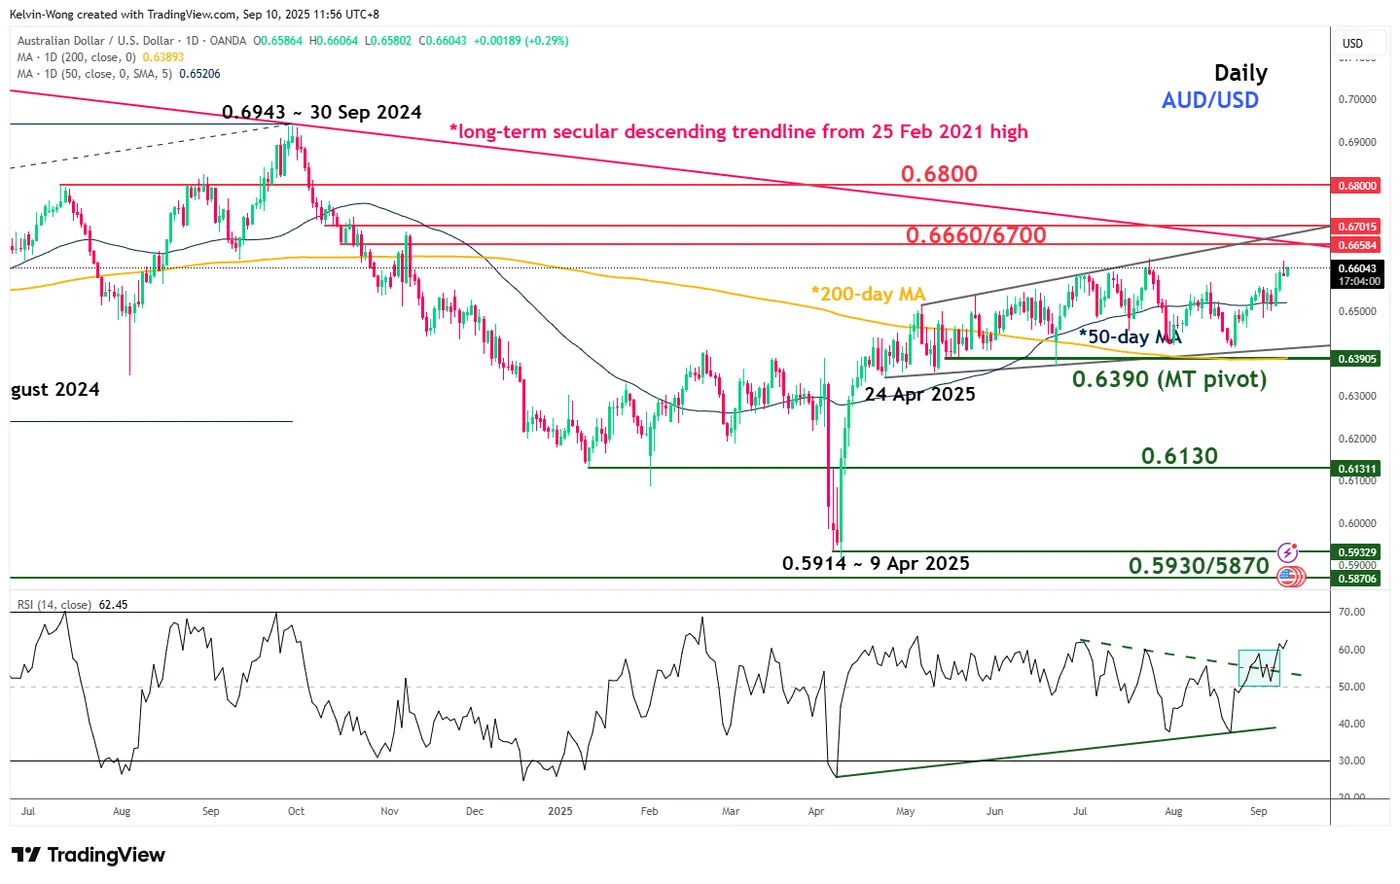
Fig. 4: AUD/USD medium-term trend as of 10 Sep 2025 (Source: TradingView)
Preferred trend bias (1-3 days)
Since its minor swing low of 0.6501 printed on 4 September 2025, AUD/USD is now undergoing a potential minor bullish acceleration phase after a retest of its 20-day moving average.
Bullish bias above 0.6580 key short-term pivotal support, and a clearance above 0.6620 sees the next intermediate resistances coming in at 0.6640 and 0.6660/0.6680 (also a Fibonacci extension cluster) (see Fig. 3).
Key elements
- Price actions of the AUD/USD have traded back above the 20-day and 50-day moving averages since last Friday, 5 September 2025, which reinforces a minor uptrend phase that is still in progress.
- The hourly RSI momentum indicator has managed to stage a rebound at its parallel ascending support, suggesting that the short-term bullish momentum condition remains intact.
- The AUD/USD is still evolving within a medium-term “Expanding Wedge” configuration since 22 April 2025, with the upper limit/resistance of the “Expanding Wedge” standing at 0.6660/0.6700 (also the long-term secular descending trendline from 25 February 2021 high) (see Fig. 4).
Alternative trend bias (1 to 3 days)
A break below 0.6580 key short-term support invalidates the bullish scenario on the AUD/USD to trigger off another round of minor corrective decline sequence to expose the next intermediate supports at 0.6550 and 0.6525.
