


Forex currencies have been dormant since the beginning of August as Markets haven’t found what they want in the latest key data reports.
As previously thought, the latest NFP, PPI, and CPI combo reports would have expected to relieve volatility in FX. But volatility there wasn’t.
After receiving all the most influential market data, the next step will be next Wednesday’s FOMC rate decision (September 17).


Prior to the CPI release, expectations for a 50 bps cut were priced at 10% and are now closer to 5%. The 25 bps cut, however, is still priced to be a sure thing.
Indeed, when looking at Market reactions in other assets, it seems that the theme that is developing is one of a less prolonged impact of tariffs.
Despite an as expected 0.3% report, participants bidding on Bonds and Gold point toward a repricing of lower long-run inflationary impact of tariffs (while they are just starting to bite now), which is flattening the US Yield curve.
Until now, pricing has been one of lower short-term inflation expectations versus higher ones in the long run.
Despite the immediate US Dollar selloff, FX currencies are hesitant and hang close to unchanged on the session.
Discover major currency pairs charts and levels, after first peaking at reactions to other asset classes.
An overlook at cross-assets market reactions: Bonds and Gold are loving it, USD corrects.
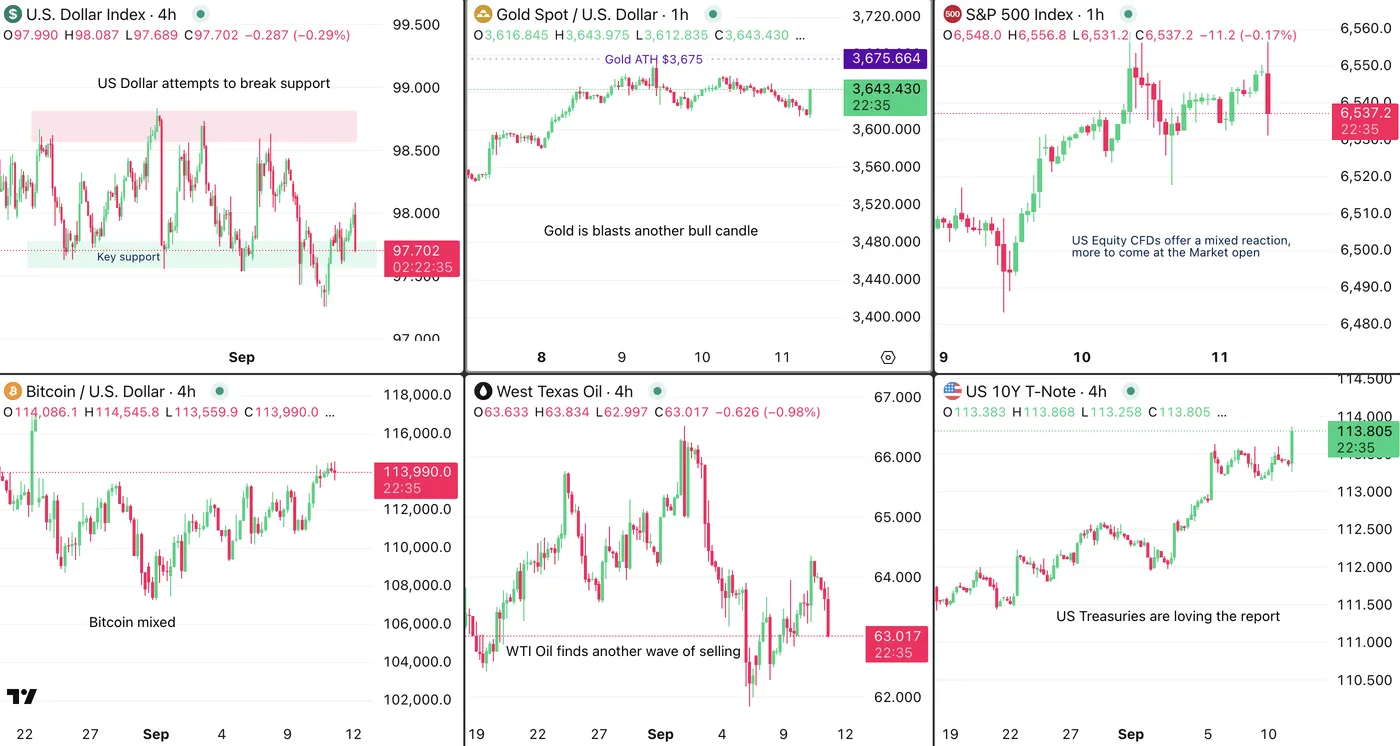
Cross-Asset charts post-CPI – September 11, 2025 – Source: TradingView
All FX Majors Charts with the immediate key levels in play
Yen likes the report but still needs more – USDJPY
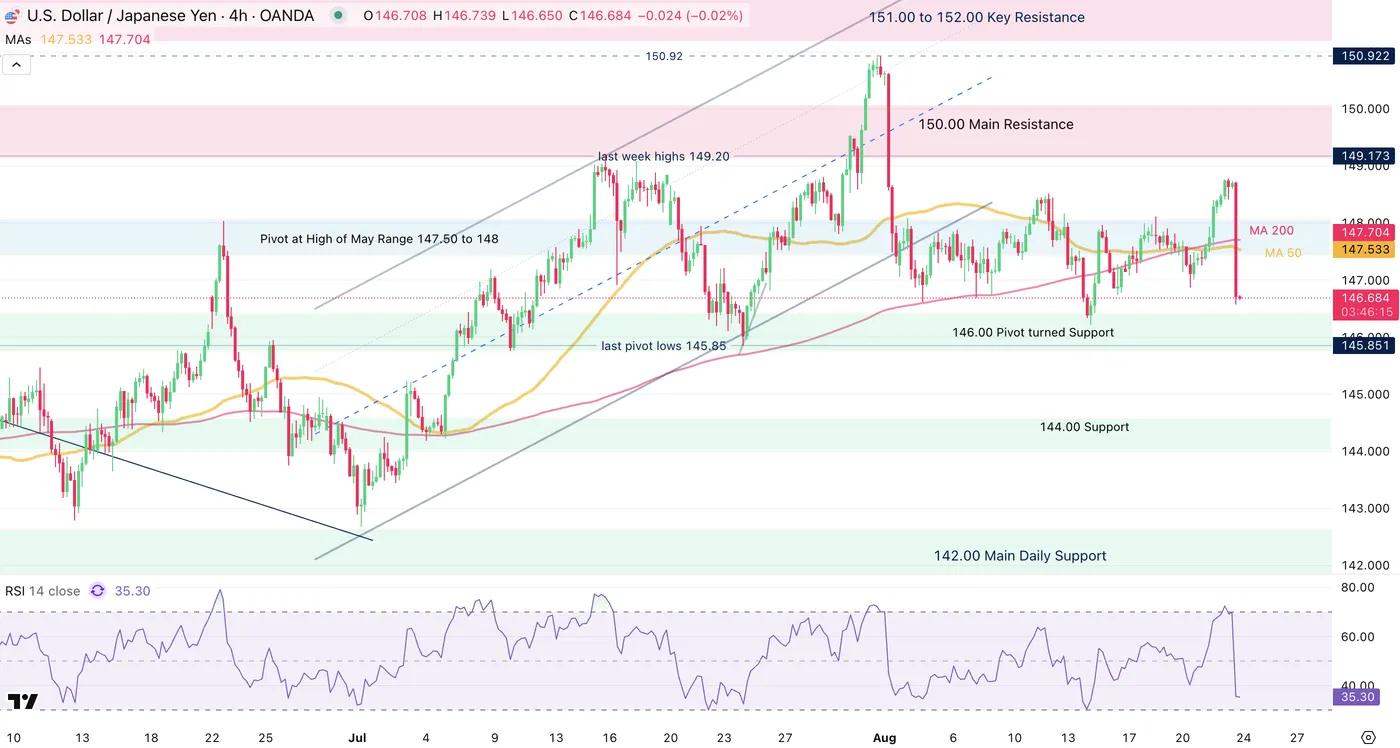
USDJPY 1H Chart, September 11, 2025, Source: TradingView
The most volatile FX pair is enjoying the ongoing selloff in the US Dollar but has yet to break out of its mid-range pivot zone.
Some ongoing selling might be pushing prices out of this region however this move still has to develop.
Wicky action at the extremes prove that participants are still hesitant on the upcoming direction for currencies.
A 25 bps confirming could still provide some strength to the USD which helps to explain why participants are still looking at each other to see who moves first
Levels to watch for USDJPY:
- Mid-range pivot 147.50 to 148.00 (currently trading – Look for breakouts of this zone)
- May Range Extremes 148.70 to 149.50 (Daily MA 200)
- 146.50 Main range Support
AUDUSD – pushing to retest yearly highs
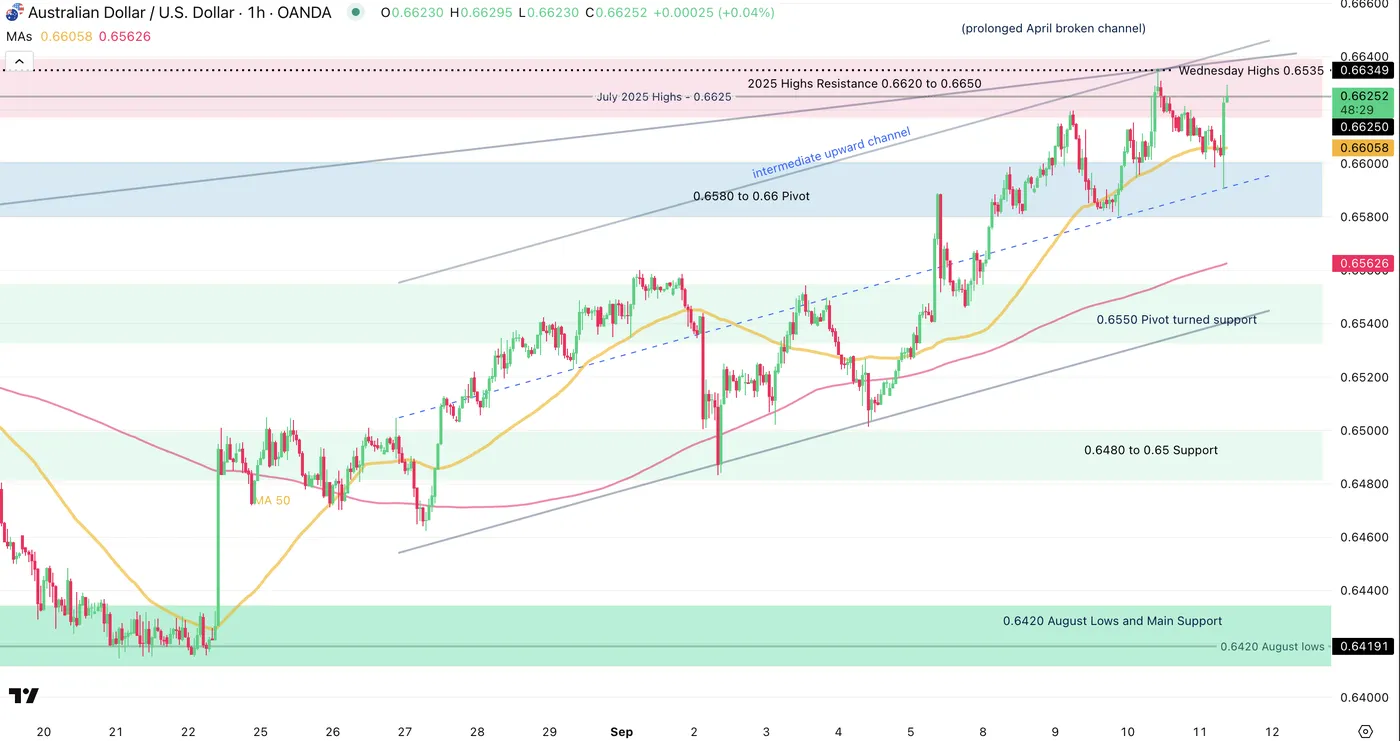
AUDUSD 1H Chart, September 11, 2025, Source: TradingView
AUDUSD has rebounded significantly since its August 1st lows and by evolving in an intermediate upward channel, heads to retest its yesterday and 2025 highs (0.6535).
Some hesitation at the current levels is forming and will be essential to monitor.
Levels to watch for AUDUSD:
- 2025 Highs Resistance 0.6620 to 0.6650
- 0.6580 to 0.66 Pivot acting as mid-term support
- 0.6550 Pivot turned support and low of intermediate channel.
EURUSD – a wicky retest of its range resistance
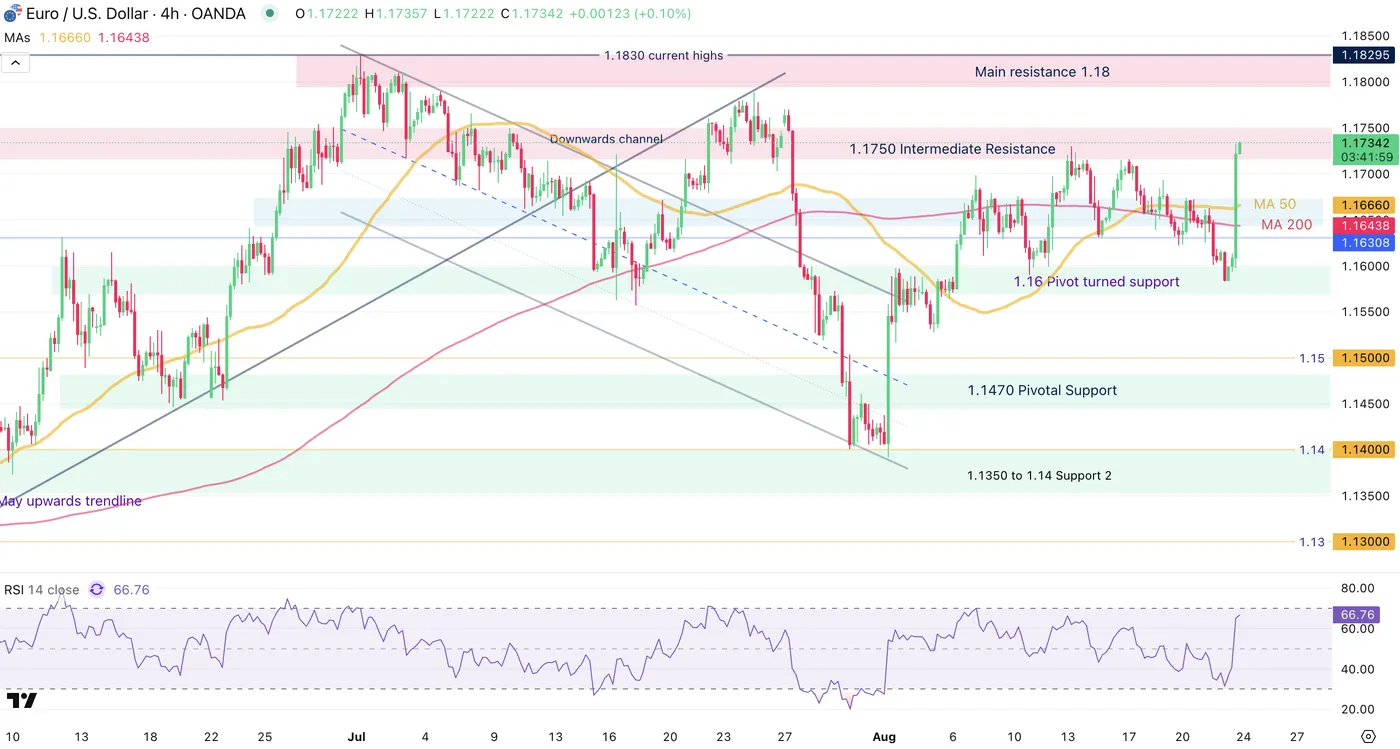
EURUSD 2H Chart, September 11, 2025, Source: TradingView
EURUSD still evolves within its August range after a failed upside breakout in yesterday’s session.
Buyers have pushed towards a retest of the resistance but seem to be running out of steam.
Levels to watch for EURUSD:
- PPI highs 1.17801
- 1.1750 Immediate Resistance
- Session lows and key range pivot 1.1660
- 1.16 Current main Support
USDCHF – Downfall stalling
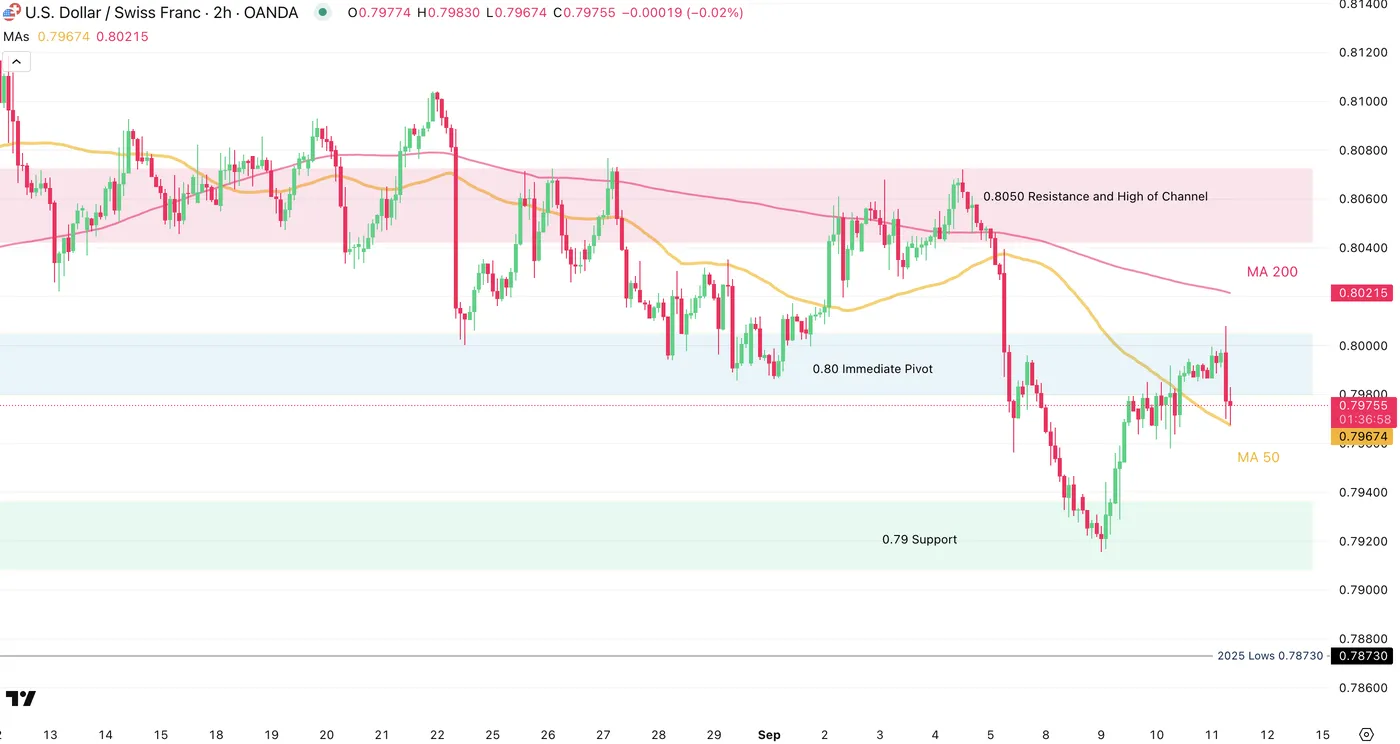
USDCHF 2H Chart, September 11, 2025, Source: TradingView
The Swiss franc had strengthened immensely in the beginning of the month which pushed USDCHF towards a retest of its 2025 Main support (0.7916 week lows).
However, despite a selling candle from the data, hesitation comes at the 50-period MA which will also be key to upcoming action: A rejection of the MA could provide a boost to the pair, while a breakdown could also lead to further downside.
Levels to watch for USDCHF:
- 0.8050 Resistance
- 0.80 Immediate Pivot and 50-period MA (action stalling here)
- 0.79 Main Support (latest rebound)
- 2025 Lows 0.78730
GBPUSD – Liked the report, but hesitant at the highs
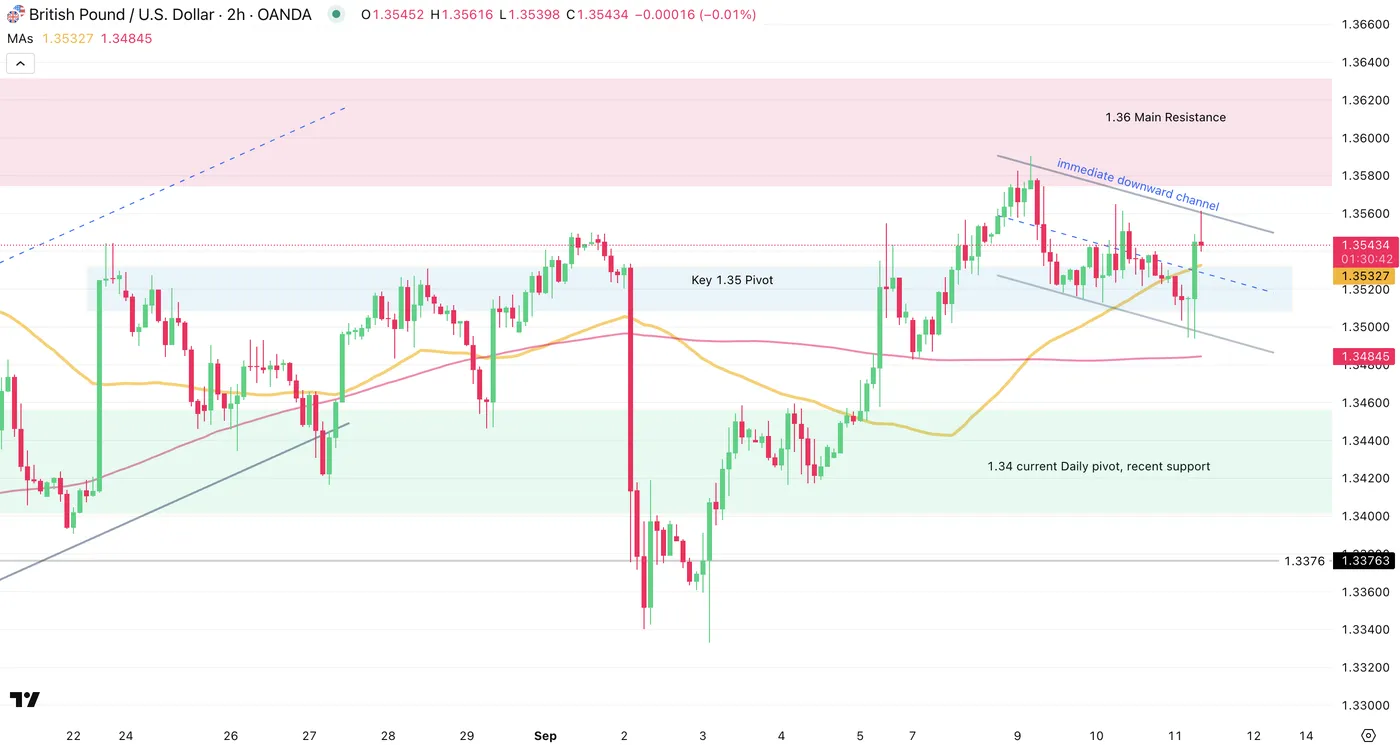
GBPUSD 2H Chart, September 11, 2025, Source: TradingView
GBPUSD has, like its European neighbor, been stuck in a 2,000 pip range since the middle of August (1.34 to 1.36).
The buying reaction to the CPI report is once again met with some hesitation as prices are meeting the range resistance.
Watch the immediate low-slope downward channel that may shape today’s price action.
Levels to watch for GBPUSD:
- 1.36 Main channel Resistance
- Key 1.35 Pivot (daily lows, key for buy/sell momentum)
- 1.34 current Daily pivot (acted as Support)
USDCAD reject its mid-term upward channel
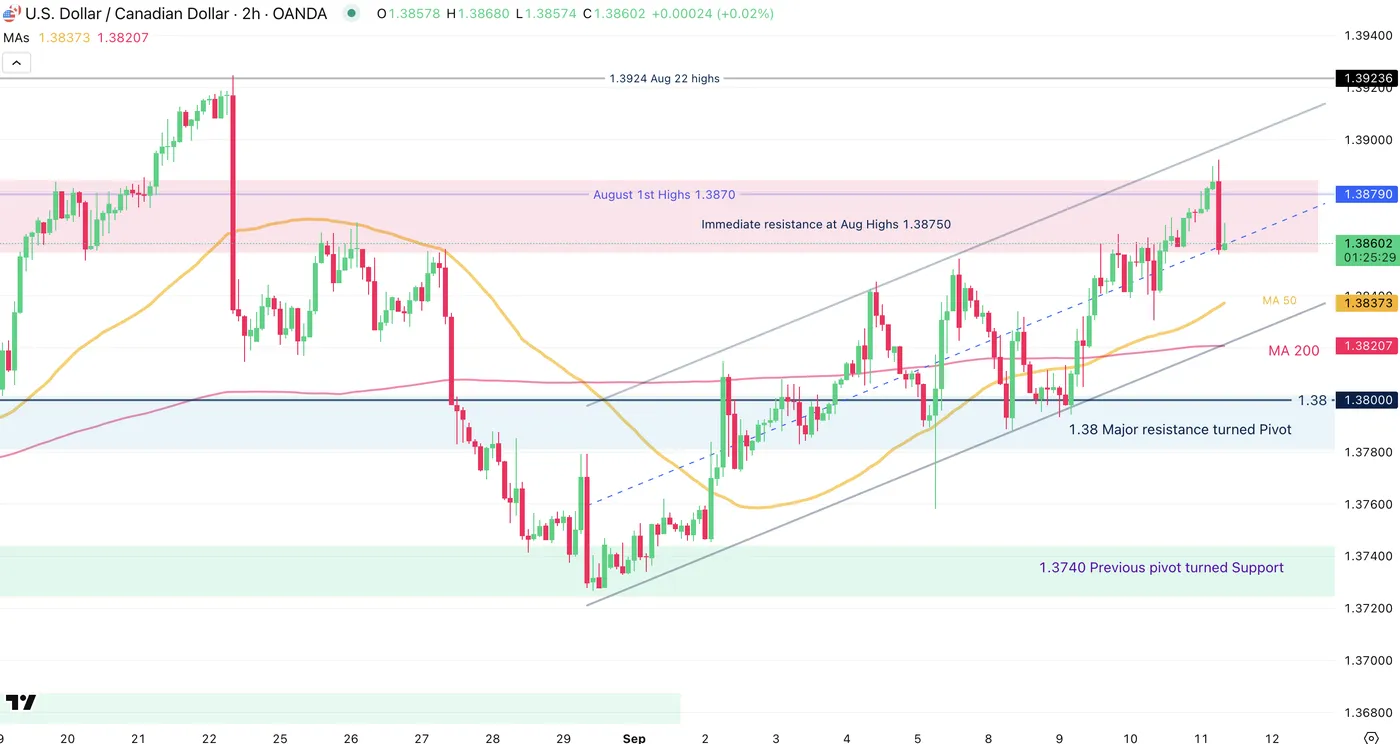
USDCAD 2H Chart, September 11, 2025, Source: TradingView
USDCAD is virtually unchanged after the report – By attaining the upper bound of its upward channel, mean-reversion selling seems to occur but real momentum has yet to materialize.
Levels to watch for USDCAD:
- Immediate resistance at Aug Highs 1.38750
- 1.38 Major resistance turned Pivot
- 1.3740 Support
Safe Trades!
