


Key takeaways:
-
Bitcoin’s price discovery reached its strongest weekly close at $123,400.
-
Onchain metrics and futures data show sustained bullish control above $122,000.
-
Short-term outlooks are split between a momentum grind higher or a mean reversion dip.
Bitcoin (BTC) achieved its strongest weekly close ever at $123,500 on Sunday, confirming its entry into a new phase of price discovery. As it consolidated near its all-time high (ATH) at $125,800, three key onchain and derivative metrics highlighted the health and sustainability of the bullish trend.

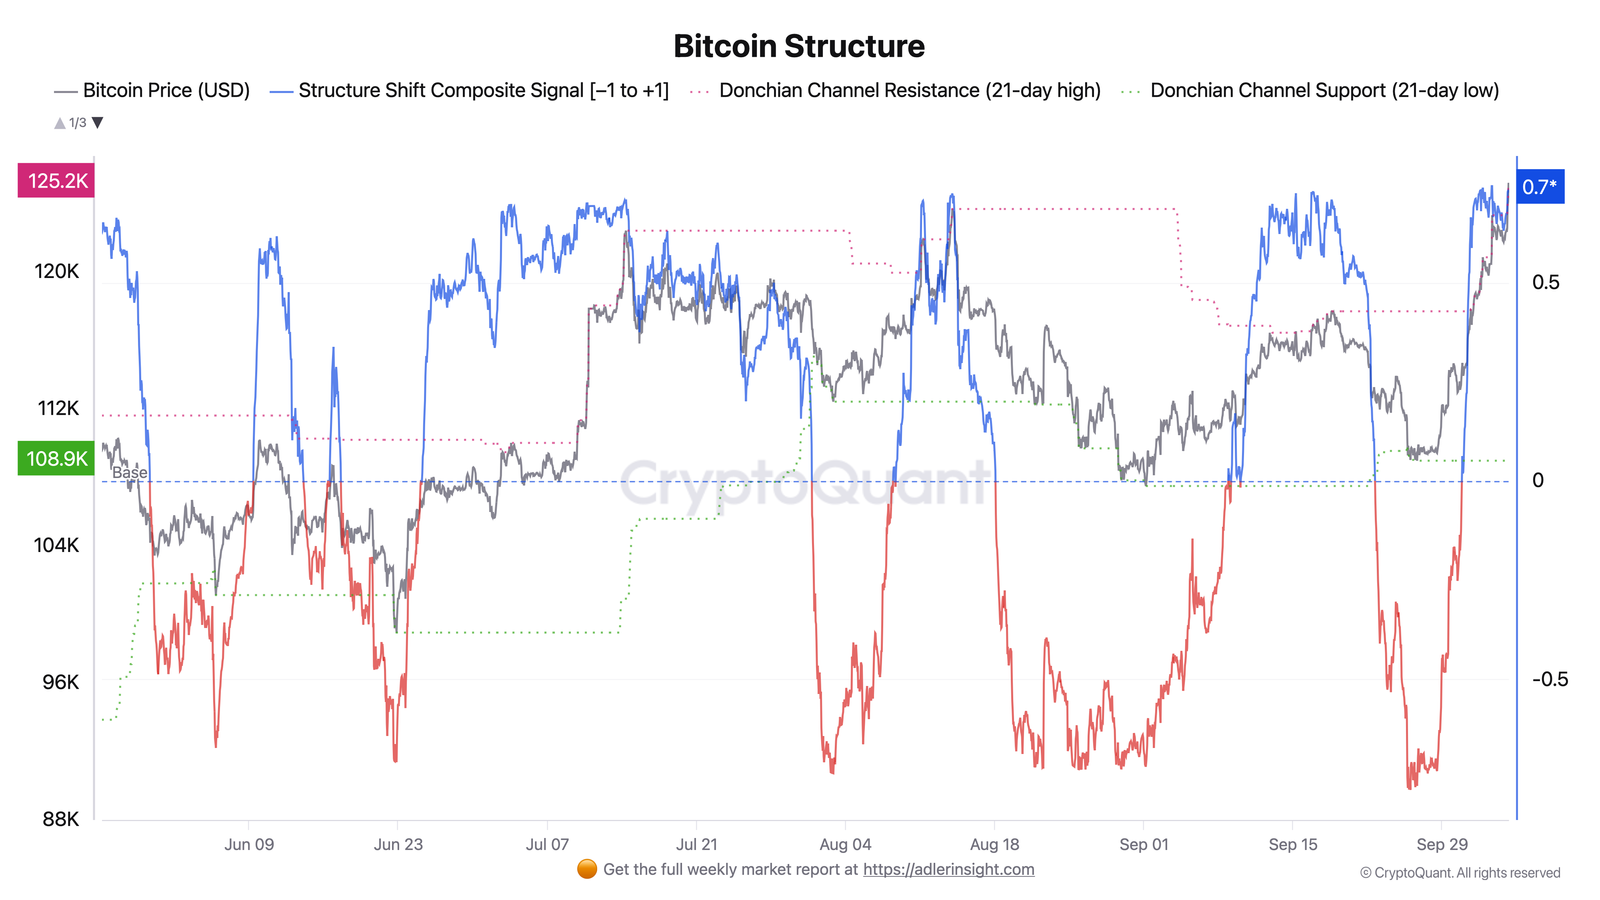
Bulls control Bitcoin’s structural momentum near $123,000
Bitcoin’s structural momentum remains decisively bullish. Bitcoin researcher Axel Adler Jr. noted that BTC’s price remained pressed against the upper boundary of the 21-day “Donchian” channel ($125,200). At the same time, the structure shift composite stays elevated at +0.73, an indicator of buyer dominance and controlled pullbacks. The ongoing battle around the $125,000 ATH could determine whether the market extends higher or pauses for consolidation.
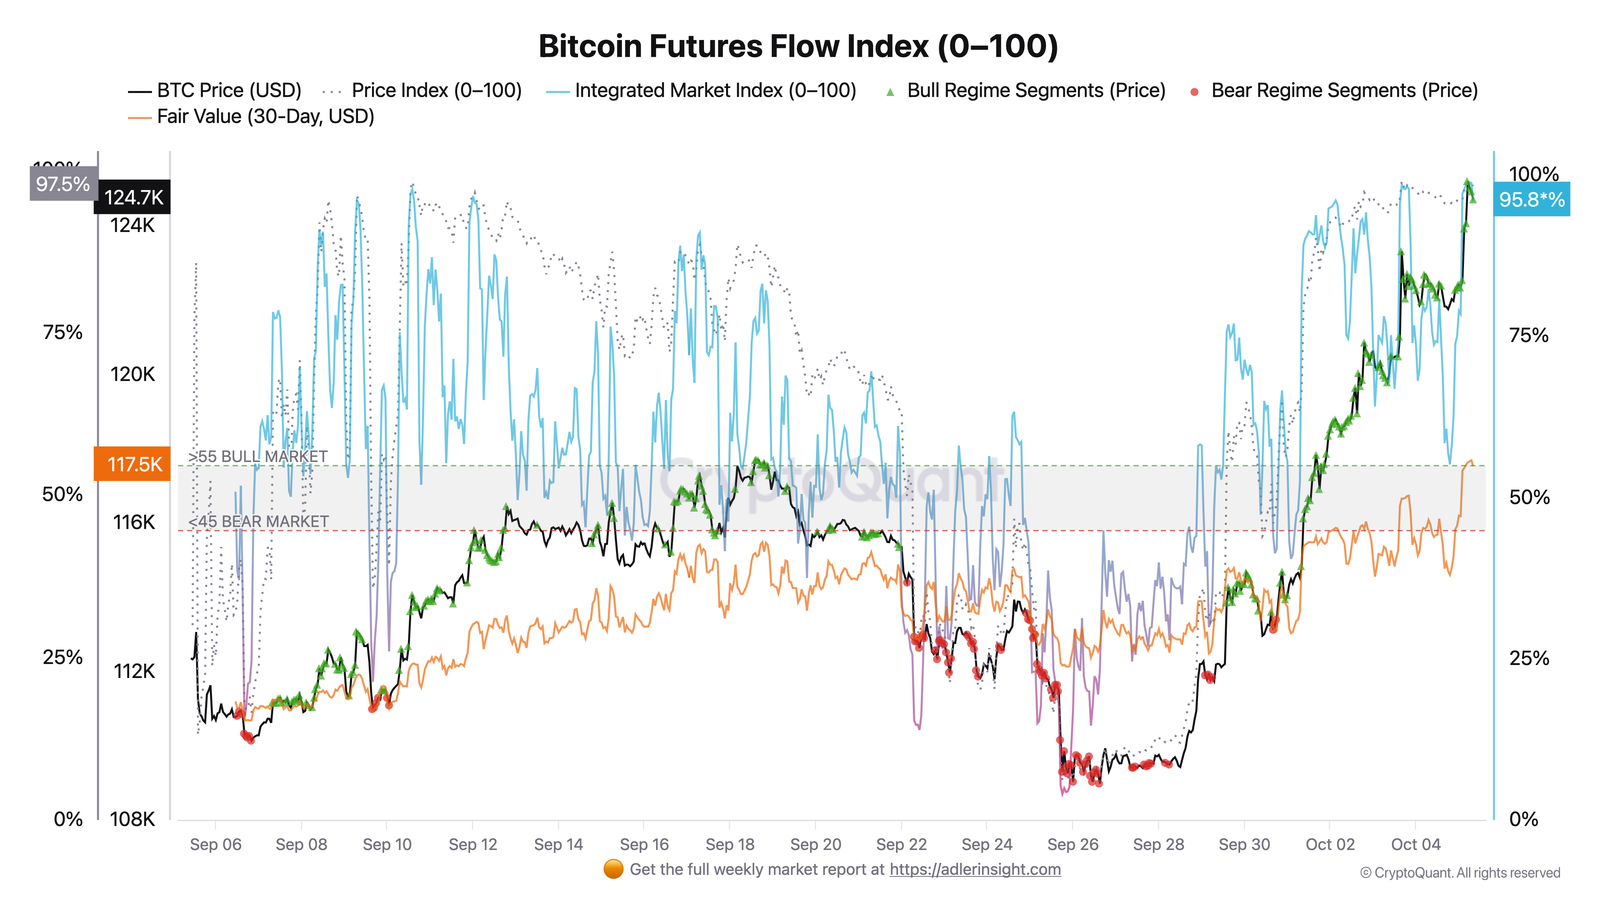
Futures flow index signals bull pressure
The Bitcoin futures flow index read 96%, with price well above its 30-day fair value of $117,500, is a classic “bullish mode” signal. This setup often precedes a brief cooling or digestion phase as overheated futures activity stabilizes before continuation.
Lastly, the Profit/Loss Block score remained at a maximum reading of +3, showing that most UTXOs are in profit, a condition that sustained strong risk appetite and consistent dip-buying behavior.
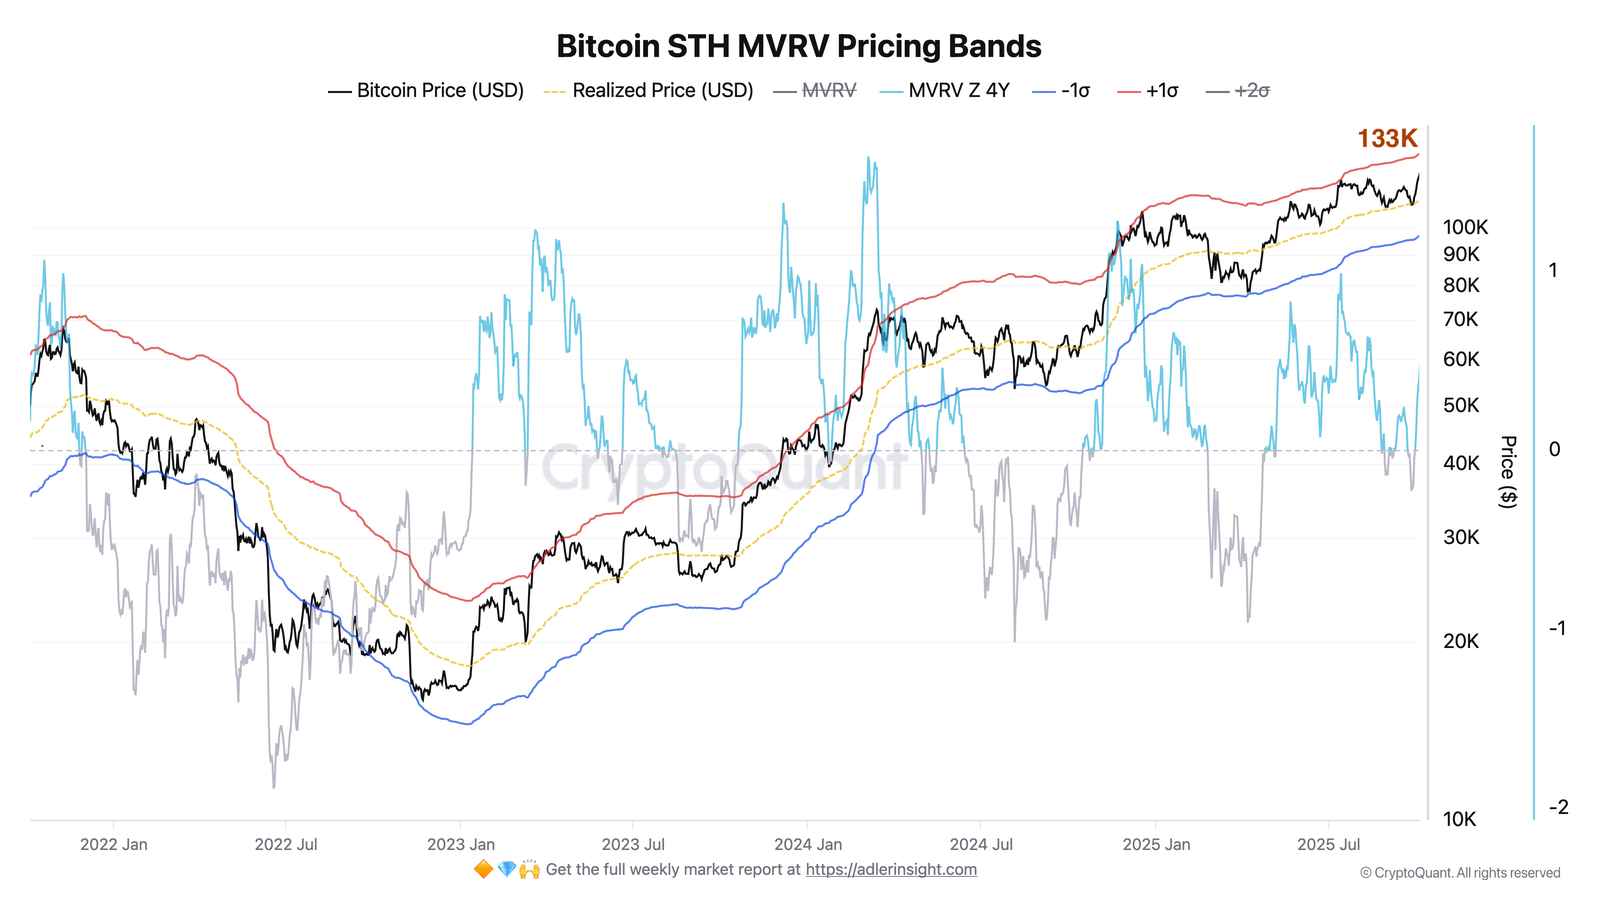
Meanwhile, the short-term holder MVRV ratio is pressing toward its +1σ band near $133,000, suggesting potential resistance as profit-taking pressure builds. Maintaining P/L momentum above the 90th percentile will be crucial to avoid divergence and trend fatigue.
Related: BTC October price breakout odds low: 5 things to know in Bitcoin this week
Short-term outlooks: A momentum grind or mean reversion for BTC?
Bitcoin’s short-term structure presented two distinct continuation scenarios following its record weekly close above $123,000.
The first scenario favored a momentum-based breakout, where “high prices stay higher.” In this case, Bitcoin could consolidate within a narrow range between $122,000 and $124,000, forming a high-timeframe base as volatility compresses.
Such behavior typically precedes gradual trend expansion, allowing the market to extend its price discovery phase through a slow grind toward fresh highs. Sustained high positioning would confirm this structure as a bullish continuation rather than a distribution.
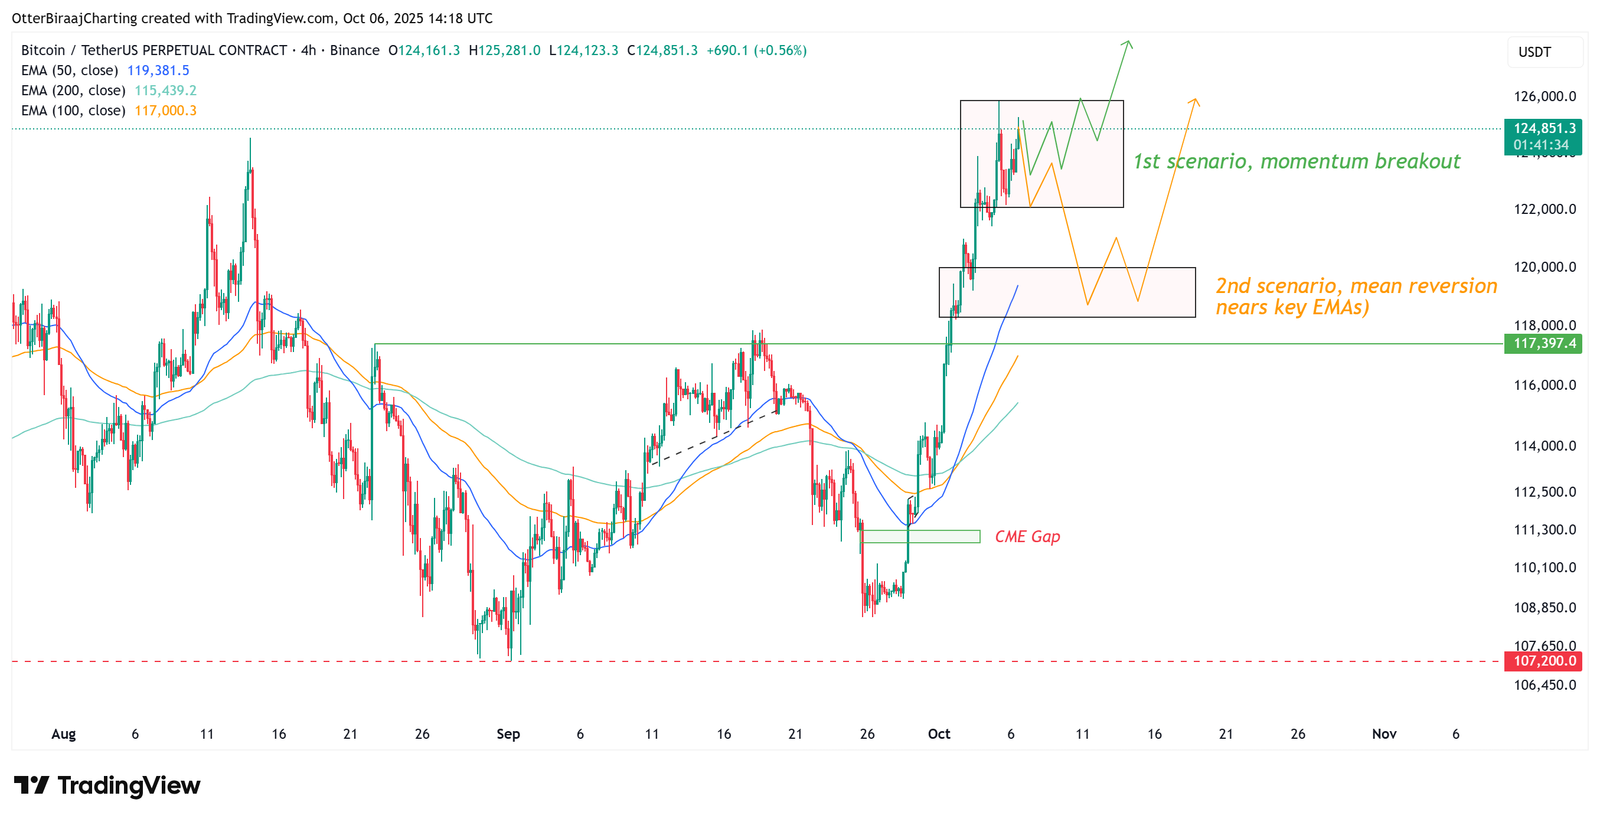
Alternatively, a mean reversion setup remained viable. This would involve a corrective retest toward key moving averages on the 4-hour chart, the 50-, 100-, and 200-period exponential moving averages (EMAs) aligning with a liquidity pocket between $118,500 and $120,000.
A pullback into this zone would reset short-term leverage, rebuild demand, and maintain structural integrity as long as $118,000 is held as higher support.
Overall, the current market balance suggested consolidation within bullish strength. Whether through steady compression or a brief liquidity sweep, the broader trend bias remained upward unless momentum fractures below the mid-$118,000 region.
Related: Bitcoin is crushing top memecoins in 2025: Can DOGE, TRUMP rebound in Q4?
This article does not contain investment advice or recommendations. Every investment and trading move involves risk, and readers should conduct their own research when making a decision.
